How to debug Dalvik and ARM code together
2014-11-05 16:16
483 查看
转:http://www.hexblog.com/?p=809
Let us have a look at application that uses a native library. On a button press, the function
Native library function returns a well-known string.
So, we have application packaged in
Because IDA cannot analyse or debug both Dalvik and native (ARM) code at the same time, we’ll need to use two IDA instances to perform debugging in turns.
To prepare the first IDA instance:
load
go to the native function call and set breakpoint there.
change the default port in “Debugger/Process options” to any other value.
start the Dalvik debugger and wait until breakpoint is hit.
Then prepare the second IDA instance:
prepare to debug native ARM Android application (copy and start
load
the name of the native function was formed by special rules and in our case it is
select “Remote ARM Linux/Android debugger” and attach to the application process.
press
Now switch to the first IDA session and press, for example, F8 to call native function. If we return back to the second IDA session then we can notice the breakpoint event.
Now we can continue to debug the native code. When we finish, press
The full source code of the example you can download from our
site.
Let us have a look at application that uses a native library. On a button press, the function
stringFromJNI()implemented in the native library is called.
package ida.debug.hellojni;
public class MainActivity extends Activity {
public native String stringFromJNI();
static {
System.loadLibrary("hello-jni");
}
@Override
public void onCreate(Bundle savedInstanceState) {
super.onCreate(savedInstanceState);
final TextView tv = new TextView(this);
final Button btn = new Button(this);
btn.setText("Press me to call the native code");
btn.setOnClickListener(new Button.OnClickListener() {
public void onClick(View v) {
tv.setText(stringFromJNI());
}
});
LinearLayout layout = new LinearLayout(this);
layout.setOrientation(LinearLayout.VERTICAL);
layout.setLayoutParams(new LayoutParams(
LayoutParams.FILL_PARENT, LayoutParams.FILL_PARENT));
layout.addView(btn);
layout.addView(tv);
setContentView(layout);
}
}
Native library function returns a well-known string.
jstring Java_ida_debug_hellojni_MainActivity_stringFromJNI(
JNIEnv* env,
jobject thiz)
{
return (*env)->NewStringUTF(env, "Hello, JNI world!");
}
So, we have application packaged in
hellojni.apkfile and installed in Android Emulator.
Because IDA cannot analyse or debug both Dalvik and native (ARM) code at the same time, we’ll need to use two IDA instances to perform debugging in turns.
To prepare the first IDA instance:
load
hellojni.apkinto IDA, select
classes.dexto analyze.
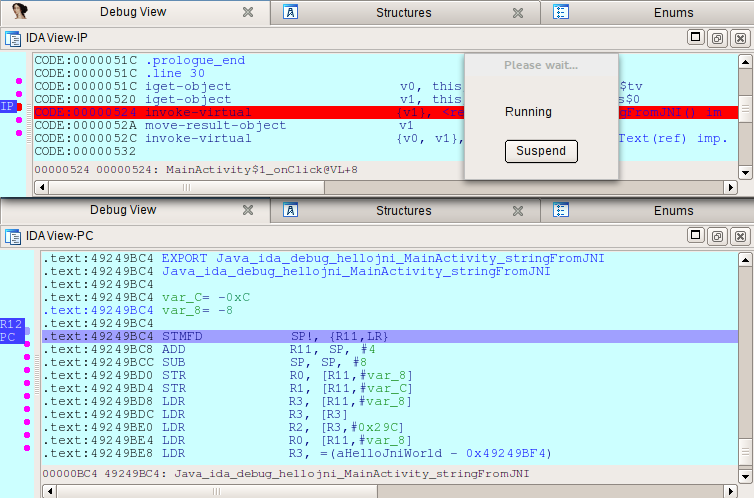
go to the native function call and set breakpoint there.
CODE:0000051C  iget-object         v0, this, MainActivity$1_val$tv
CODE:00000520  iget-object         v1, this, MainActivity$1_this$0
CODE:00000524  invoke-virtual      {v1},
<ref MainActivity.stringFromJNI() imp. @ _def_MainActivity_stringFromJNI@L>
CODE:0000052A  move-result-object  v1
change the default port in “Debugger/Process options” to any other value.
start the Dalvik debugger and wait until breakpoint is hit.
Then prepare the second IDA instance:
prepare to debug native ARM Android application (copy and start
android_serverand so on).
load
hellojni.apkinto IDA, and now select
lib/armeabi-v7a/libhello-jni.soto analyze.
the name of the native function was formed by special rules and in our case it is
Java_ida_debug_hellojni_MainActivity_stringFromJNI(), so go to to it and set a breakpoint:
.text:00000BC4 EXPORT Java_ida_debug_hellojni_MainActivity_stringFromJNI
.text:00000BC4 Java_ida_debug_hellojni_MainActivity_stringFromJNI
.text:00000BC4
.text:00000BC4 var_C  = -0xC
.text:00000BC4 var_8  = -8
.text:00000BC4
.text:00000BC4        STMFD   SP!, {R11,LR}
.text:00000BC8        ADD     R11, SP, #4
.text:00000BCC        SUB     SP, SP, #8
.text:00000BD0        STR     R0, [R11,#var_8]
.text:00000BD4        STR     R1, [R11,#var_C]
.text:00000BD8        LDR     R3, [R11,#var_8]
.text:00000BDC        LDR     R3, [R3]
.text:00000BE0        LDR     R2, [R3,#0x29C]
.text:00000BE4        LDR     R0, [R11,#var_8]
.text:00000BE8        LDR     R3, =(aHelloJniWorld - 0xBF4)
.text:00000BEC        ADD     R3, PC, R3 ; "Hello, JNI world!"
.text:00000BF0        MOV     R1, R3
.text:00000BF4        BLX     R2
.text:00000BF8        MOV     R3, R0
.text:00000BFC        MOV     R0, R3
.text:00000C00        SUB     SP, R11, #4
.text:00000C04        LDMFD   SP!, {R11,PC}
.text:00000C04 ; End of function
Java_ida_debug_hellojni_MainActivity_stringFromJNI
select “Remote ARM Linux/Android debugger” and attach to the application process.
press
F9to continue.
Now switch to the first IDA session and press, for example, F8 to call native function. If we return back to the second IDA session then we can notice the breakpoint event.
Now we can continue to debug the native code. When we finish, press
F9and return to the first IDA session.
The full source code of the example you can download from our
site.

相关文章推荐
- How to compile and debug VLC player source code in eclipse IDE on Ubuntu 10.04 (lucid)?
- How to debug an Angular 2 application with Chrome and VS Code
- How to compile and debug VLC player source code in eclipse IDE on Ubuntu 10.04 (lucid)
- Using gdbserver and arm-eabi-gdb to debug native code in Android
- How to collect TrustZone debug logs and check the meaning of error code in the logs
- How to build and debug android source code
- How to Enable and Run a Payables Concurrent Program in Debug Mode
- How to call code behind method in JavaScript in C# and VS2010?
- Java ThreadLocal - How to use and code sample
- Java ThreadLocal - How to use and code sample
- [Sharepoint]How to Complete Task using code and send to next task
- How to generate core dump file and debug with it?
- android sw watchdog and How to Debug
- An example on how to use jQuery and Ajax.NET Professional together
- How to use UTF-8_with_BOM, XML and Java together
- Android: How to download the latest zip Android Source Code easily and using it in Intellij
- How to Code .NET: Tips and Tricks for Coding .NET 1.1 and .NET 2.0 Applications Effectively
- How to debug test code on Windows Mobile Emulator with Visual Studio
- [Drupal] How to add the js file and js code block in Drupal
- How to debug SceneLib with Eclipse and How to install SceneLib 1.0 on Ubuntu 10.04