nagios监控cisco交换机流量
2014-09-20 00:12
260 查看
在交换机上启用snmp并配置团体名(交换换机IP192.168.5.209)
Switch(config)#snmp-server community public ro
Switch(config)#snmp-server community public rw
2.在nagios服务器上输入如下命令获取交换机的index信息
[root@localhost ~]# /usr/local/nagios/libexec/check_traffic.sh -V 2c -C public -H 192.168.5.209 -L
List Interface for host 192.168.5.209.
Interface index 1 orresponding to Vlan1
Interface index 10001 orresponding to FastEthernet0/1
Interface index 10002 orresponding to FastEthernet0/2
Interface index 10003 orresponding to FastEthernet0/3
Interface index 10004 orresponding to FastEthernet0/4
Interface index 10005 orresponding to FastEthernet0/5
Interface index 10006 orresponding to FastEthernet0/6
Interface index 10007 orresponding to FastEthernet0/7
Interface index 10008 orresponding to FastEthernet0/8
Interface index 10009 orresponding to FastEthernet0/9
Interface index 10010 orresponding to FastEthernet0/10
Interface index 10011 orresponding to FastEthernet0/11
Interface index 10012 orresponding to FastEthernet0/12
Interface index 10013 orresponding to FastEthernet0/13
Interface index 10014 orresponding to FastEthernet0/14
Interface index 10015 orresponding to FastEthernet0/15
Interface index 10016 orresponding to FastEthernet0/16
Interface index 10017 orresponding to FastEthernet0/17
Interface index 10018 orresponding to FastEthernet0/18
Interface index 10019 orresponding to FastEthernet0/19
Interface index 10020 orresponding to FastEthernet0/20
Interface index 10021 orresponding to FastEthernet0/21
Interface index 10022 orresponding to FastEthernet0/22
Interface index 10023 orresponding to FastEthernet0/23
Interface index 10024 orresponding to FastEthernet0/24
Interface index 10101 orresponding to GigabitEthernet0/1
Interface index 10102 orresponding to GigabitEthernet0/2
Interface index 10501 orresponding to Null0
3.在nagios服务器上输入如下命令获取交换机的F0/1的流量信息
[root@localhost ~]# /usr/local/nagios/libexec/check_traffic.sh -V 2c -C public -H 192.168.5.209 -I 10001 -w 200,300 -c 400,500 -K -B
OK - It's the first time for this plugins run. We'll get the data from the next time.
#第一次提示OK...,30秒后再次输入此命令
[root@localhost ~]# /usr/local/nagios/libexec/check_traffic.sh -V 2c -C public -H 192.168.5.209 -I 10001 -w 200,300 -c 400,500 -K -B
OK - The Traffic In is 1.00KB, Out is 0.62KB, Total is 1.62KB. The Check Interval is 46s |In=1.00KB;200;400;0;0 Out=0.62KB;300;500;0;0 Total=1.62KB;500;900;0;0 Interval=46s;1200;1800;0;0
4.在commands.cfg 中添加check_traffic命令(在监控windows流量中已添加)

5.修改nagios.cfg,
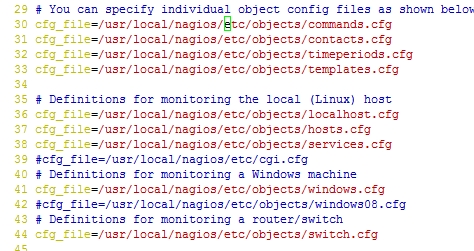
44 去掉 cfg_file=/usr/local/nagios/etc/objects/switch.cfg 的#号
6.修改switch.cfg,定义switch主机名和监控服务
[root@localhost ~]# vim /usr/local/nagios/etc/objects/switch.cfg

25 使用generic-switch,此模板已存在templates.cfg中定义
26 主机名 使用了默认的 ,可以自定义
28 交换机的IP
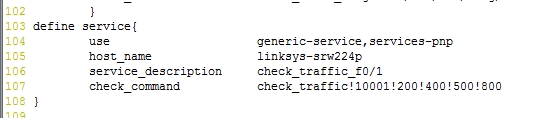
104 services-pnp,使用画图,装有pnp才有效果
105 要监控的主机名 links-srw224p,已在26行定义
106 服务描述 名称自定义
107 检查命令 check_traffic 已在commands.cfg中定义 10001 是交换机f0/1的index值 200 400 是
进/出流量(单位KB)超过这个值会发出警告,500 800 是进/出流量超过这个值会发出报警(根据实际情况设置这些流量值)
7.测试修改内容是否有错误,并重启nagios进程
[root@localhost ~]# /usr/local/nagios/bin/nagios -v /usr/local/nagios/etc/nagios.cfg
[root@localhost ~]# ps -ef | grep nagios
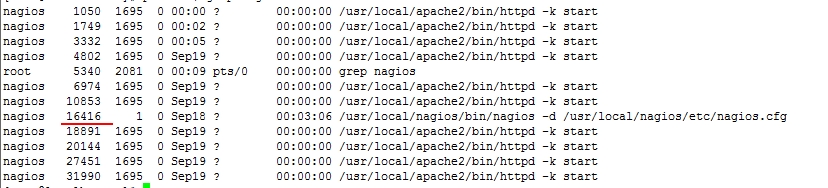
[root@localhost ~]# kill 16416
[root@localhost ~]# /usr/local/nagios/bin/nagios -d /usr/local/nagios/etc/nagios.cfg
8.访问nagios监控页面

提示/var/tmp有个临时文件,把/var/tmp/ 下的临时文件全部删除
[root@localhost ~]# cd /var/tmp/
[root@localhost tmp]# rm -f *
再杀掉进程,启动进程,刷新监控页面


总结:这篇是根据前几篇继续做的
nagios服务搭建可参考http://nmszh.blog.51cto.com/4609205/1551295
snmpd.conf设置可参考http://nmszh.blog.51cto.com/4609205/1554465
services-pnp可参考http://nmszh.blog.51cto.com/4609205/1551644
Switch(config)#snmp-server community public ro
Switch(config)#snmp-server community public rw
2.在nagios服务器上输入如下命令获取交换机的index信息
[root@localhost ~]# /usr/local/nagios/libexec/check_traffic.sh -V 2c -C public -H 192.168.5.209 -L
List Interface for host 192.168.5.209.
Interface index 1 orresponding to Vlan1
Interface index 10001 orresponding to FastEthernet0/1
Interface index 10002 orresponding to FastEthernet0/2
Interface index 10003 orresponding to FastEthernet0/3
Interface index 10004 orresponding to FastEthernet0/4
Interface index 10005 orresponding to FastEthernet0/5
Interface index 10006 orresponding to FastEthernet0/6
Interface index 10007 orresponding to FastEthernet0/7
Interface index 10008 orresponding to FastEthernet0/8
Interface index 10009 orresponding to FastEthernet0/9
Interface index 10010 orresponding to FastEthernet0/10
Interface index 10011 orresponding to FastEthernet0/11
Interface index 10012 orresponding to FastEthernet0/12
Interface index 10013 orresponding to FastEthernet0/13
Interface index 10014 orresponding to FastEthernet0/14
Interface index 10015 orresponding to FastEthernet0/15
Interface index 10016 orresponding to FastEthernet0/16
Interface index 10017 orresponding to FastEthernet0/17
Interface index 10018 orresponding to FastEthernet0/18
Interface index 10019 orresponding to FastEthernet0/19
Interface index 10020 orresponding to FastEthernet0/20
Interface index 10021 orresponding to FastEthernet0/21
Interface index 10022 orresponding to FastEthernet0/22
Interface index 10023 orresponding to FastEthernet0/23
Interface index 10024 orresponding to FastEthernet0/24
Interface index 10101 orresponding to GigabitEthernet0/1
Interface index 10102 orresponding to GigabitEthernet0/2
Interface index 10501 orresponding to Null0
3.在nagios服务器上输入如下命令获取交换机的F0/1的流量信息
[root@localhost ~]# /usr/local/nagios/libexec/check_traffic.sh -V 2c -C public -H 192.168.5.209 -I 10001 -w 200,300 -c 400,500 -K -B
OK - It's the first time for this plugins run. We'll get the data from the next time.
#第一次提示OK...,30秒后再次输入此命令
[root@localhost ~]# /usr/local/nagios/libexec/check_traffic.sh -V 2c -C public -H 192.168.5.209 -I 10001 -w 200,300 -c 400,500 -K -B
OK - The Traffic In is 1.00KB, Out is 0.62KB, Total is 1.62KB. The Check Interval is 46s |In=1.00KB;200;400;0;0 Out=0.62KB;300;500;0;0 Total=1.62KB;500;900;0;0 Interval=46s;1200;1800;0;0
4.在commands.cfg 中添加check_traffic命令(在监控windows流量中已添加)
5.修改nagios.cfg,
44 去掉 cfg_file=/usr/local/nagios/etc/objects/switch.cfg 的#号
6.修改switch.cfg,定义switch主机名和监控服务
[root@localhost ~]# vim /usr/local/nagios/etc/objects/switch.cfg
25 使用generic-switch,此模板已存在templates.cfg中定义
26 主机名 使用了默认的 ,可以自定义
28 交换机的IP
104 services-pnp,使用画图,装有pnp才有效果
105 要监控的主机名 links-srw224p,已在26行定义
106 服务描述 名称自定义
107 检查命令 check_traffic 已在commands.cfg中定义 10001 是交换机f0/1的index值 200 400 是
进/出流量(单位KB)超过这个值会发出警告,500 800 是进/出流量超过这个值会发出报警(根据实际情况设置这些流量值)
7.测试修改内容是否有错误,并重启nagios进程
[root@localhost ~]# /usr/local/nagios/bin/nagios -v /usr/local/nagios/etc/nagios.cfg
[root@localhost ~]# ps -ef | grep nagios
[root@localhost ~]# kill 16416
[root@localhost ~]# /usr/local/nagios/bin/nagios -d /usr/local/nagios/etc/nagios.cfg
8.访问nagios监控页面
提示/var/tmp有个临时文件,把/var/tmp/ 下的临时文件全部删除
[root@localhost ~]# cd /var/tmp/
[root@localhost tmp]# rm -f *
再杀掉进程,启动进程,刷新监控页面
总结:这篇是根据前几篇继续做的
nagios服务搭建可参考http://nmszh.blog.51cto.com/4609205/1551295
snmpd.conf设置可参考http://nmszh.blog.51cto.com/4609205/1554465
services-pnp可参考http://nmszh.blog.51cto.com/4609205/1551644

相关文章推荐
- nagios监控cisco交换机流量
- nagios监控网卡流量
- Cisco交换机路由器开启SNMP流量监控
- Nagios 网卡流量监控
- nagios监控网卡流量
- nagios监控windows网卡流量
- nagios监控网卡流量
- nagios监控mysql主机,nginx,磁盘IO,网卡流量
- nagios监控mysql主机,nginx,磁盘IO,网卡流量
- 基于nagios的监控环境(四):第三方插件监控流量、CPU、内存、进程
- nagios监控网络流量
- nagios 流量监控和报警的shell脚本
- nagios监控告警之网络流量监控(附pnp模板)
- Nagios 下监控服务器流量(linux平台下)
- nagios流量监控的三种方法
- 如何设置Cisco交换机Vlan 并且监控特定网口的流量
- nagios 监控流量插件check_traffic
- Nagios监控Windows的网卡流量
- Nagios监控Windows的网卡流量
- nagios监控网卡流量