通过案例学习调优之--Oracle ASH
2014-08-18 17:19
381 查看
通过案例学习调优之--Oracle ASH
应用环境:操作系统: RedHat EL55Oracle: Oracle 10gR2
案例场景:
SCOTT用户做事务处理,事务已经完成!
16:55:43 SYS@ prod>@?/rdbms/admin/ashrpt
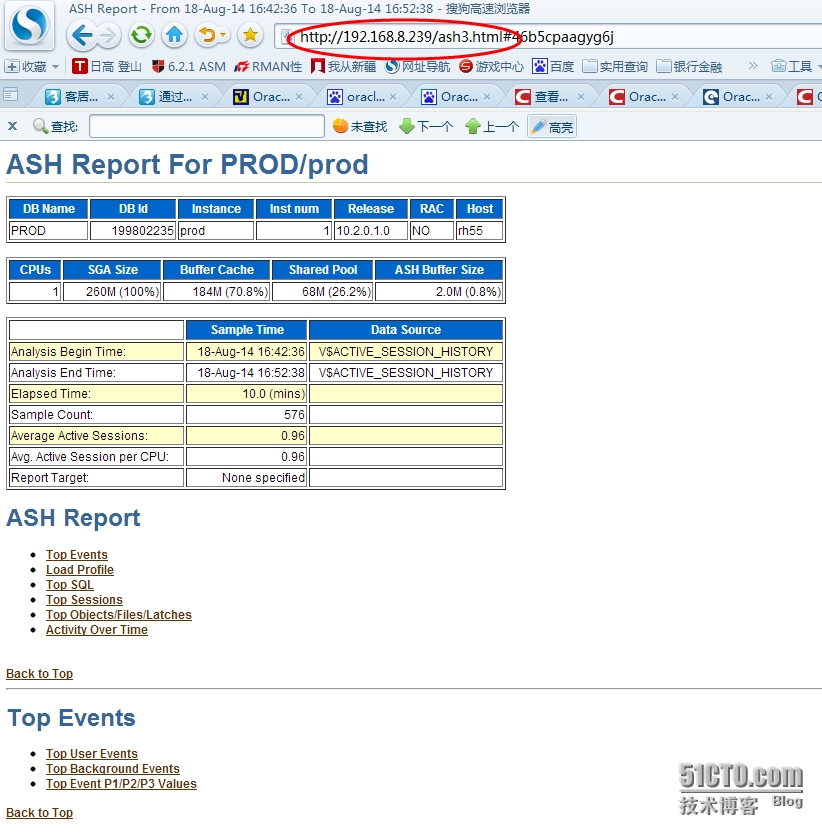
基本信息
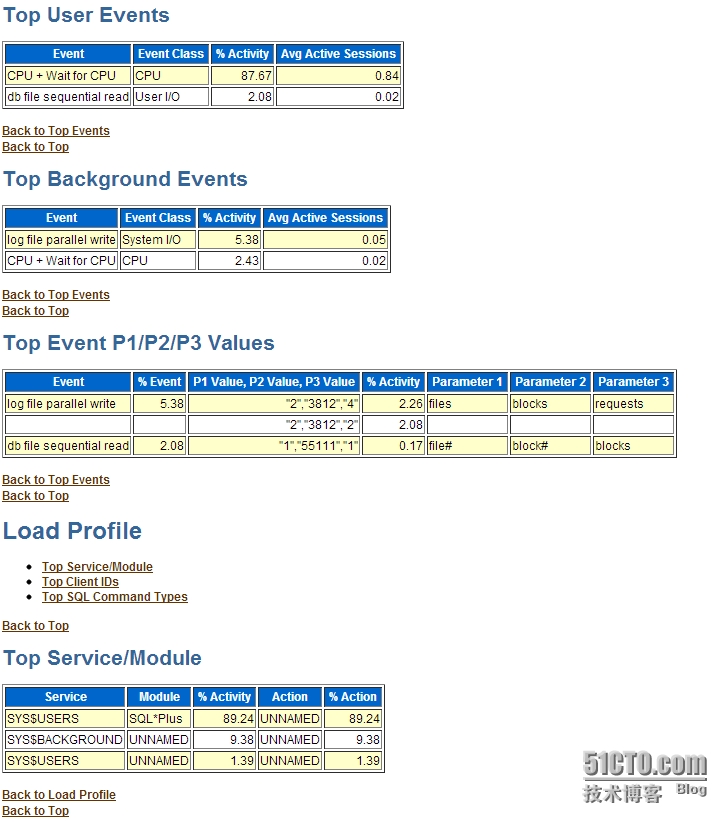
TOP事件:User TOP EVENTS
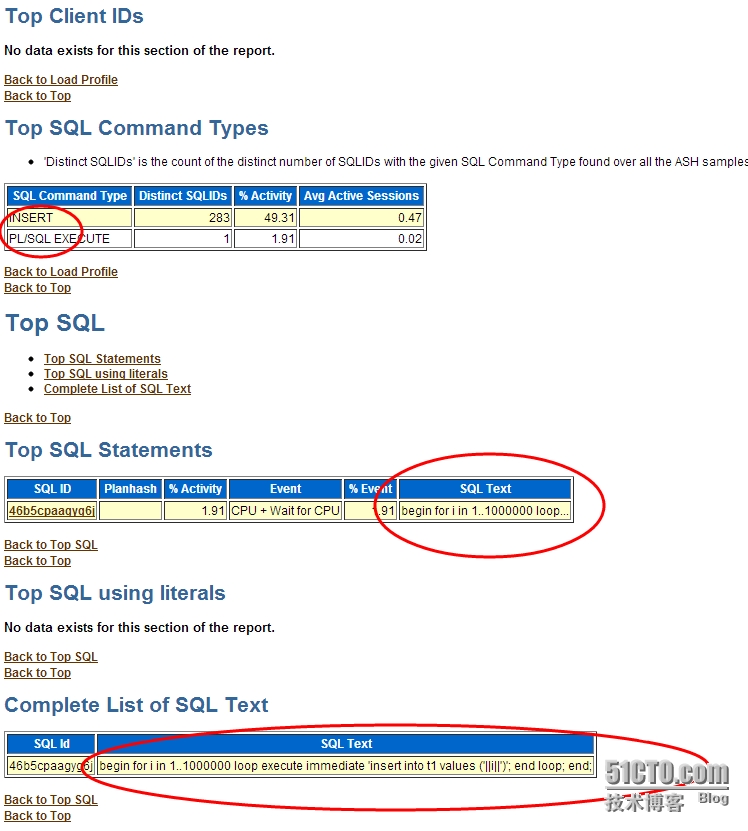
TOP SQL
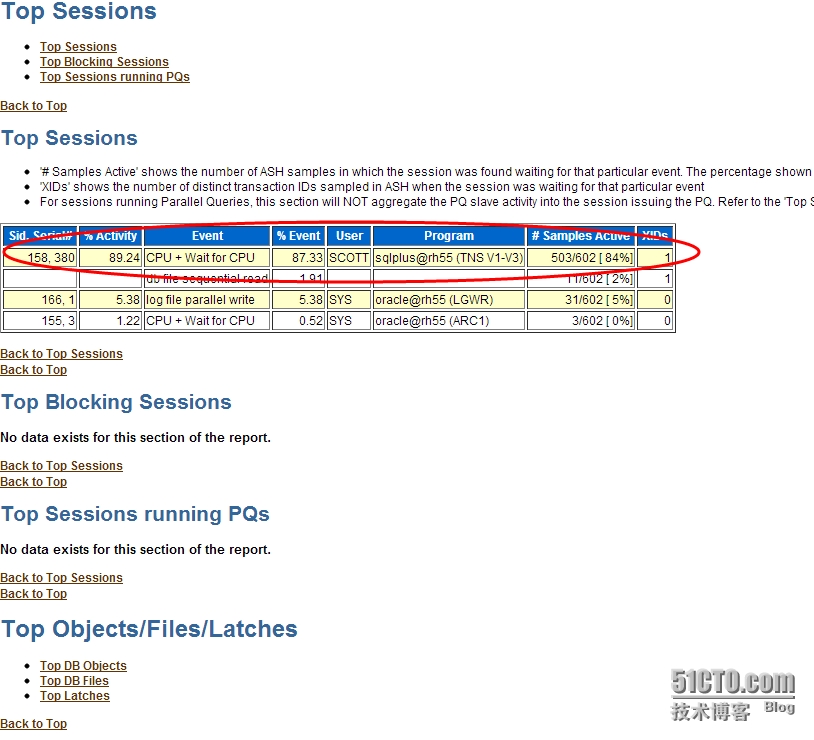
TOP SESSION
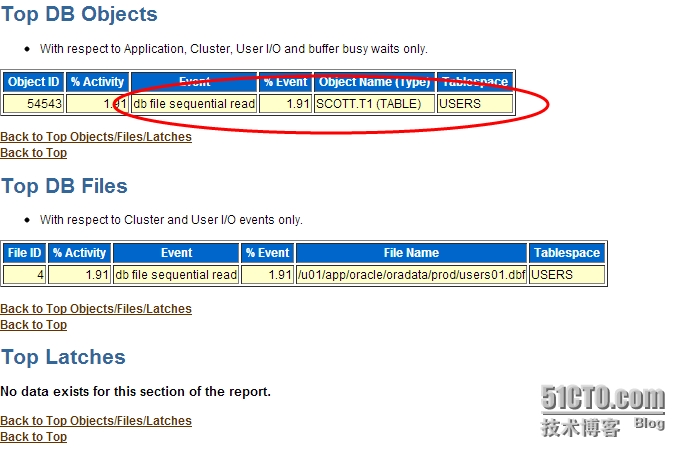
TOP OBJECTS
ASH 说明 ASH以V$SESSION为基础,每秒采样一次,记录活动会话等待的事件。不活动的会话不会采样,采样工作由新引入的后台进程MMNL来完成。 ASH buffers 的最小值为1MB,最大值不超过30MB。内存中记录数据。期望值是记录一小时的内容。ASH内存分配:SQL> select * from v$sgastat where name like '%ASH%';
POOL NAME BYTES
------------ -------------------------- ----------
shared pool ASH buffers 8388608
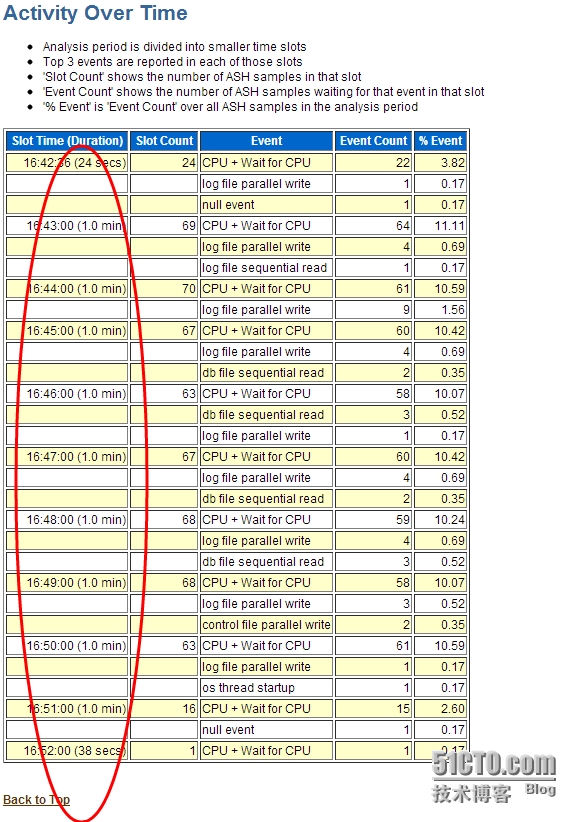
ASH报告生成脚本:@?/rdbms/admin/ashrpt.sql ASH内存记录数据始终是有限的,为了保存历史数据,引入了自动负载信息库(Automatic Workload Repository ,AWR) 由后台进程MMON完成。ASH信息同样被采集写出到AWR负载库中。由于内存不是足够的,所以MMNL进程在ASH写满后会将信息写出到AWR负载库中。ASH全部写出是不可接受的,所以一般只写入收集的10%的数据量,而且使用direct-path insert完成,尽量减少日志的生成,从而最小化数据库性能影响。 内存中的ASH 信息可以通过V$ACTIVE_SESSION_HISTORY查询,而写出到AWR负载库的ASH信息,可以通过AWR的基础表wrh$_active_session_history查询,wrh$_active_session_history是一个分区表,Oracle会自动进行数据清理。 一般来说,我们在监控数据库时,如果是当前正在发生的问题,我们可以通过v$session+v$sqlarea来找出性能最差的SQL语句。如果在一个小时以内发生的我们可以通过生成ASH报告来找出SQL。如果是1小时以上或几天我们可以通过AWR报告来找出几小时,几天以来最影响系统的SQL语句。ADDM报告基于AWR库,默认可以保存30天的ADDM报告。相关查询试图:v$session (当前正在发生)v$session_wait (当前正在发生)v$session_wait_history (会话最近的10次等待事件)v$active_session_history (内存中的ASH采集信息,理论为1小时)wrh$_active_session_history (写入AWR库中的ASH信息,理论为1小时以上)dba_hist_active_sess_history (根据wrh$_active_session_history生成的视图) 三. ASH 报告生成示例 ASH组件以v$active_session_history视图为基础,生成ASH报表,ASH报表与statspack类似,可以提供以下信息:Top User EventsTop Background EventsTop Event P1/P2/P3 ValuesTop Service/ModuleTop Client IDsTop SQL Command TypesTop SQL using literalsTop Blocking SessionsTop DB ObjectsTop DB FilesTop LatchesActivity Over Time 报表间隔时间可以精确到分钟,因而ASH可以提供比STATSPACK或AWR更详细的关于历史会话的信息,可以作为statspack或awr的补充。ASH报告通过@$ORACLE_HOME/rdbms/admin/ashrpt.sql脚本生成,包括hmtl和text两种格式。
本文出自 “天涯客的blog” 博客,请务必保留此出处http://tiany.blog.51cto.com/513694/1541673
应用环境:操作系统: RedHat EL55Oracle: Oracle 10gR2
案例场景:
SCOTT用户做事务处理,事务已经完成!
16:42:14 SYS@ prod>conn scott/tiger
Connected.
16:42:20 SCOTT@ prod>begin
16:42:23   2  for i in 1..1000000 loop
16:42:27   3  execute immediate 'insert into t1 values ('||i||')';
16:42:32   4  end loop;
16:42:36   5  end;
16:42:38   6  /
PL/SQL procedure successfully completed.
Elapsed: 00:08:35.77
16:51:14 SCOTT@ prod>commit;
Commit complete. 生成ASH报告:16:55:43 SYS@ prod>@?/rdbms/admin/ashrpt
Current Instance ~~~~~~~~~~~~~~~~ DB Id DB Name Inst Num Instance ----------- ------------ -------- ------------ 199802235 PROD 1 prod Elapsed: 00:00:00.07 Specify the Report Type ~~~~~~~~~~~~~~~~~~~~~~~ Enter 'html' for an HTML report, or 'text' for plain text Defaults to 'html' Enter value for report_type: html Type Specified: html Instances in this Workload Repository schema ~~~~~~~~~~~~~~~~~~~~~~~~~~~~~~~~~~~~~~~~~~~~ DB Id Inst Num DB Name Instance Host ------------ -------- ------------ ------------ ------------ * 199802235 1 PROD prod rh55 Defaults to current database Using database id: 199802235 Defaults to current instance Using instance number: 1 ASH Samples in this Workload Repository schema ~~~~~~~~~~~~~~~~~~~~~~~~~~~~~~~~~~~~~~~~~~~~~~ Oldest ASH sample available: 15-Aug-14 11:55:37 [ 4625 mins in the past] Latest ASH sample available: 18-Aug-14 17:00:17 [ 1 mins in the past] Specify the timeframe to generate the ASH report ~~~~~~~~~~~~~~~~~~~~~~~~~~~~~~~~~~~~~~~~~~~~~~~~ Enter begin time for report: -- Valid input formats: -- To specify absolute begin time: -- [MM/DD[/YY]] HH24:MI[:SS] -- Examples: 02/23/03 14:30:15 -- 02/23 14:30:15 -- 14:30:15 -- 14:30 -- To specify relative begin time: (start with '-' sign) -- -[HH24:]MI -- Examples: -1:15 (SYSDATE - 1 Hr 15 Mins) -- -25 (SYSDATE - 25 Mins) Defaults to -15 mins Enter value for begin_time: -10 Enter duration in minutes starting from begin time: Defaults to SYSDATE - begin_time Press Enter to analyze till current time Enter value for duration: Report duration specified: Using 18-Aug-14 16:51:39 as report begin time Using 18-Aug-14 17:01:40 as report end time Specify Slot Width (using ashrpti.sql) for 'Activity Over Time' section ~~~~~~~~~~~~~~~~~~~~~~~~~~~~~~~~~~~~~~~~~~~~~~~~~~~~~~~~~~~~~~~~~~~~~~~ -- Explanation: -- In the 'Activity Over Time' section of the ASH report, -- the analysis period is divided into smaller slots -- and top wait events are reported in each of those slots. -- Default: -- The analysis period will be automatically split upto 10 slots -- complying to a minimum slot width of -- 1 minute, if the source is V$ACTIVE_SESSION_HISTORY or -- 5 minutes, if the source is DBA_HIST_ACTIVE_SESS_HISTORY. Specify Slot Width in seconds to use in the 'Activity Over Time' section: Defaults to a value as explained above: Slot Width specified: Specify Report Targets (using ashrpti.sql) to generate the ASH report ~~~~~~~~~~~~~~~~~~~~~~~~~~~~~~~~~~~~~~~~~~~~~~~~~~~~~~~~~~~~~~~~~~~~~ -- Explanation: -- ASH Report can accept "Report Targets", -- like a particular SQL statement, or a particular SESSION, -- to generate the report on. If one or more report targets are -- specified, then the data used to generate the report will only be -- the ASH samples that pertain to ALL the specified report targets. -- Default: -- If none of the report targets are specified, -- then the target defaults to all activity in the database instance. Specify SESSION_ID (eg: from V$SESSION.SID) report target: Defaults to NULL: SESSION report target specified: Specify SQL_ID (eg: from V$SQL.SQL_ID) report target: Defaults to NULL: (% and _ wildcards allowed) SQL report target specified: Specify WATI_CLASS name (eg: from V$EVENT_NAME.WAIT_CLASS) report target: [Enter 'CPU' to investigate CPU usage] Defaults to NULL: (% and _ wildcards allowed) WAIT_CLASS report target specified: Specify SERVICE_HASH (eg: from V$ACTIVE_SERVICES.NAME_HASH) report target: Defaults to NULL: SERVICE report target specified: Specify MODULE name (eg: from V$SESSION.MODULE) report target: Defaults to NULL: (% and _ wildcards allowed) MODULE report target specified: Specify ACTION name (eg: from V$SESSION.ACTION) report target: Defaults to NULL: (% and _ wildcards allowed) ACTION report target specified: Specify CLIENT_ID (eg: from V$SESSION.CLIENT_IDENTIFIER) report target: Defaults to NULL: (% and _ wildcards allowed) CLIENT_ID report target specified: Specify the Report Name ~~~~~~~~~~~~~~~~~~~~~~~ The default report file name is ashrpt_1_0818_1704.html. To use this name, press <return> to continue, otherwise enter an alternative. Enter value for report_name: ash3.html查看生成报告通过html方式查看ASH报告:
基本信息
TOP事件:User TOP EVENTS
TOP SQL
TOP SESSION
TOP OBJECTS
ASH 说明 ASH以V$SESSION为基础,每秒采样一次,记录活动会话等待的事件。不活动的会话不会采样,采样工作由新引入的后台进程MMNL来完成。 ASH buffers 的最小值为1MB,最大值不超过30MB。内存中记录数据。期望值是记录一小时的内容。ASH内存分配:SQL> select * from v$sgastat where name like '%ASH%';
POOL NAME BYTES
------------ -------------------------- ----------
shared pool ASH buffers 8388608
ASH报告生成脚本:@?/rdbms/admin/ashrpt.sql ASH内存记录数据始终是有限的,为了保存历史数据,引入了自动负载信息库(Automatic Workload Repository ,AWR) 由后台进程MMON完成。ASH信息同样被采集写出到AWR负载库中。由于内存不是足够的,所以MMNL进程在ASH写满后会将信息写出到AWR负载库中。ASH全部写出是不可接受的,所以一般只写入收集的10%的数据量,而且使用direct-path insert完成,尽量减少日志的生成,从而最小化数据库性能影响。 内存中的ASH 信息可以通过V$ACTIVE_SESSION_HISTORY查询,而写出到AWR负载库的ASH信息,可以通过AWR的基础表wrh$_active_session_history查询,wrh$_active_session_history是一个分区表,Oracle会自动进行数据清理。 一般来说,我们在监控数据库时,如果是当前正在发生的问题,我们可以通过v$session+v$sqlarea来找出性能最差的SQL语句。如果在一个小时以内发生的我们可以通过生成ASH报告来找出SQL。如果是1小时以上或几天我们可以通过AWR报告来找出几小时,几天以来最影响系统的SQL语句。ADDM报告基于AWR库,默认可以保存30天的ADDM报告。相关查询试图:v$session (当前正在发生)v$session_wait (当前正在发生)v$session_wait_history (会话最近的10次等待事件)v$active_session_history (内存中的ASH采集信息,理论为1小时)wrh$_active_session_history (写入AWR库中的ASH信息,理论为1小时以上)dba_hist_active_sess_history (根据wrh$_active_session_history生成的视图) 三. ASH 报告生成示例 ASH组件以v$active_session_history视图为基础,生成ASH报表,ASH报表与statspack类似,可以提供以下信息:Top User EventsTop Background EventsTop Event P1/P2/P3 ValuesTop Service/ModuleTop Client IDsTop SQL Command TypesTop SQL using literalsTop Blocking SessionsTop DB ObjectsTop DB FilesTop LatchesActivity Over Time 报表间隔时间可以精确到分钟,因而ASH可以提供比STATSPACK或AWR更详细的关于历史会话的信息,可以作为statspack或awr的补充。ASH报告通过@$ORACLE_HOME/rdbms/admin/ashrpt.sql脚本生成,包括hmtl和text两种格式。
本文出自 “天涯客的blog” 博客,请务必保留此出处http://tiany.blog.51cto.com/513694/1541673

相关文章推荐
- 通过案例学习调优之--Oracle ASH
- 通过脚本案例学习shell(一)如何通过复杂锁脚本解决脚本正在运行或者被意外中断问题 推荐
- 通过脚本案例学习shell(三) --- 通过交互式脚本自动创建Apache虚拟主机 推荐
- 通过案例学调优之--IOSTAT(查看磁盘I/O)
- 通过案例学调优之--AWR基本概念
- 【iOS开发-54】案例学习:通过UIScrollView的缩放图片功能练习代理模式的具体实现
- {传智播客} (学习笔记)--通过一些简单案例,了解Oracle存储过程编写和调用
- 通过案例学调优之--SQL Profile
- 通过案例学调优之--Oracle数据块(block)
- 通过案例学调优之--10046事件
- 通过案例学调优之--AWR BaseLine管理
- 通过脚本案例学习shell(四) --- 通过脚本初始化并加固新安装的Linux系统 推荐
- 通过 Autostereograms 案例学习 OpenGL 和 OpenCL 的互操作性
- 通过 Autostereograms 案例学习 OpenGL 和 OpenCL 的互操作性
- 通过案例学调优之--模拟buffer busy waits事件
- 通过脚本案例学习shell(二) --- 通过线性显示/etc/passwd内容了解while read用法 推荐
- 通过一个天气预报案例学习asp.net WebService(基于asp.net MVC)
- 通过案例学调优之--动态视图(v$bh和x$bh)
- 通过案例学调优之--分区表基本管理
- 通过案例学调优之--AWR baseline对比生成AWR报告