Matlab绘图——Draw ROC Curve
2014-03-19 11:18
169 查看
Draw ROC Curve
A piece of fairly simple Matlab script to draw the ROCCurve from an array of scores and an array of labels.
function [Tps, Fps] = ROC(scores, labels)

%% Sort Labels and Scores by Scores
sl = [scores; labels];
[d1 d2] = sort(sl(1,:));

sorted_sl = sl(:,d2);
s_scores = sorted_sl(1,:);
s_labels = round(sorted_sl(2,:));

%% Constants
counts = histc(s_labels, unique(s_labels));

Tps = zeros(1, size(s_labels,2) + 1);
Fps = zeros(1,  size(s_labels,2) + 1);

negCount = counts(1);
posCount = counts(2);

%% Shift threshold to find the ROC
for thresIdx = 1:(size(s_scores,2)+1)

% for each Threshold Index
tpCount = 0;
fpCount = 0;

for i = [1:size(s_scores,2)]

if (i >= thresIdx)           % We think it is positive
if (s_labels(i) == 1)   % Right!
tpCount = tpCount + 1;
else                    % Wrong!
fpCount = fpCount + 1;
end
end

end

Tps(thresIdx) = tpCount/posCount;
Fps(thresIdx) = fpCount/negCount;

end

%% Draw the Curve

% Sort [Tps;Fps]
x = Tps;
y = Fps;

% Interplotion to draw spline line
count = 100;
dist = (x(1) - x(size(x,2)))/100;
xx = [x(1):-dist:x(size(x,2))];

% In order to get the interpolations, we remove all the unique numbers
[d1 d2] = unique(x);
uni_x = x(1,d2);
uni_y = y(1,d2);
yy = spline(uni_x,uni_y,xx);

% No value should exceed 1
yy = min(yy, 1);

plot(x,y,'x',xx,yy);
Hope it helps.
Some improvements were added.
For a sample input:
>> scores = rand(1,20)*100

scores =

Columns 1 through 7

43.8744   38.1558   76.5517   79.5200   18.6873   48.9764   44.5586

Columns 8 through 14

64.6313   70.9365   75.4687   27.6025   67.9703   65.5098   16.2612

Columns 15 through 20

11.8998   49.8364   95.9744   34.0386   58.5268   22.3812

>> labels = round(rand(1,20))

labels =

Columns 1 through 12

1     0     1     1     1     1     1     0     0     0     1     0

Columns 13 through 20

1     0     1     0     0     0     1     0

>> ROC(scores,labels);
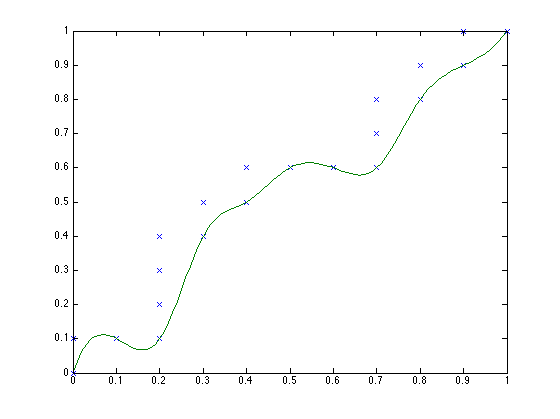
Gives an output like:
转自:http://haoxiang.org/2012/02/draw-roc-curve/

相关文章推荐
- Matlab Graphics - Curve 绘图
- MATLAB基本绘图操作
- MATLAB之绘图基础
- Matlab绘图系列之高级绘图
- MATLAB绘图
- sklearn的roc_curve()函数分析
- MATLAB学习笔记(五)——MATLAB绘图
- iOS的绘图之drawRect和drawLayer:inContext
- 基于MATLAB GUI界面的MCU串口实时绘图设计
- Matlab 绘图基础
- 关于Matlab绘图的一点基础小结
- matlab绘图、计算基本函数(二)
- Matlab计算结果的可视化-plot绘图
- **MATLAB** MATLAB中的绘图功能
- Matlab绘图-很详细,很全面
- Matlab绘图-很详细,很全面
- Graphics.DrawCurve的算法
- Matlab中使用Java api绘图图形并保存为jpeg格式
- matlab读取RGB888或RGB565像素文件并绘图
- matlab 三维绘图汇总