BTrace
2014-03-14 00:00
435 查看
Sometimes you need to audit or profile your Java application. The easiest but most intrusive way to do this is to do a bunch of System.out.printlns (which is obviously bad) or to use loggers. After adding a lot of logging statements, your application becomes cluttered with unnecessary boilerplate code.
Profiling, instrumentation or method measuring are great examples of cross-cutting concerns that might be nicely solved using AOP (Aspect Oriented Programming.) Basically, it allows you to invoke a certain action upon some defined conditions without the need for changing the instrumented code. The process of applying the aspects to your code is called weaving.
There are three types of weaving (not every AOP implementation must support all of them):
source code weaving (the aspect is applied to the inspected source code before the compilation),
byte code weaving (the aspect is applied to the compiled, .class file),
runtime weaving (the aspect is applied to the running, live application within the JVM).
As a side note, you can create your own simple runtime weaving AOP tool by using Java Agents that are invoked before any other written source code method (in the matter of fact, agent methods are invoked even before thestatic void main(String[] args) method of your Java class.)
Table of contents
What is the BTrace?
How Can I Use it?
Exemplary Source Code to be Instrumented
Why the WeakReference?
Exemplary BTrace Script
Ways of Getting the Results
Invoking the Script
JStat Counter Access
MBeans Access
Weak References and Garbage Collection
Strong References and Garbage Collection
Overhead
Summary
The big advantage of runtime weaving is that you are not forced to recompile the source code you want to instrument nor to have to stop it. You can just plug into already executed application and start monitoring it right away.
You can write the BTrace script and use btrace utility (it comes with the BTrace distribution) to apply your script to the running application,
You can write the BTrace script and compile it using BTrace provided compiler,
You can dynamically apply the BTrace script using the VisualVM.
I’ll focus on the third option, as in my opinion it seems to be the easiest and fastest. Nevertheless, one command that might be very useful for you despite the chosen method is the jps. It allows you to show what Java processes are currently running. The PID showed in the output will be useful in some of the further commands.
Data.java this is the data that will be stored in the cache; users will try to fetch it using the key which is a randomly generated integer number from range <0, 100):
view raw
src/com/piotrnowicki/btrace/Data.java
DataAccessor.java is the main logic of the application. It stores a cache (map of weak references to Data objects) and allows clients to access its getData(-) method.
If the requested data is in the cache, it is retrieved and returned to the caller.
If it’s not in the cache, a new data is created, stored in the cache and returned to the caller:
view raw
src/com/piotrnowicki/btrace/DataAccessor.java
Executor.java is the entry point for this application. It’s simulating a few hundreds data read access events, sleeping for a random time (0 – 1000 msec) between the requests:
view raw
src/com/piotrnowicki/btrace/Executor.java
The weak references are good for caching purposes as they are eligible for collecting by GC despite the fact they are still accessible from the map instance.
Note that the WeakHashMap wouldn’t be a good candidate for this purpose as it makes a weak references to the mapkeys, not values in which we’re interested in.
If you want to learn more about strong, soft, weak and phantom references please refer to Ethan Nicholas’s article.
Beware that you are not allowed to use any non-BTrace methods nor to create new objects within the BTrace methods. The point is to guarantee that the script is read-only and as non-intrusive as possible, therefore you are not allowed to do e.g. String concatenations. You must use only methods from the BTraceUtils class that can provide you e.g. mentioned string concatenation, comparisons, aggregation, parsing methods, etc.
view raw
CacheMonitorBTrace.java hosted with ❤ by
GitHub
All information about different probes locations as well as the requirements for the BTrace script methods and fields can be found here, so I won’t duplicate it.
However, I’ll try to explain what does the @OnMethod really do as it was quite unclear for me when I was writing the script.
Basically, all @OnMethod annotations define places where probes should be applied to the source code. The @Locationallows you to further narrow the probe location. So:
means that when the control will return from the DataAccessor#getData(-) method’s body, the probe will be activated (body of the addMethodDuration method will be invoked.)
The Kind.Return is required when you want to use @Duration annotated argument. It’s quite reasonable – if you want to know how long did the method body take, you need to probe just before the return statement.
means that we want to set a probe in DataAccessor#getData(-) method (clazz and method attributes) but we’re interested only in calls to the WeakReference#get(-) from within the DataAccessor#getData(-) method (locationattribute). Only when such call is made, the probe will be activated.
means that we want to set a probe in any method within the DataAccessor class (clazz and method attributes) but we’re interested only in dependent methods entry events (location.)
means that we want to set a probe in DataAccessor#getData(-) method (clazz and method attributes) but the probe will be activated only upon instantiation of the Data objects within this method (location.)
print it to the output using print(-) methods: println(Strings.strcat(“Entered method: “, probeMethod));
export the value to the jstat counter using @Export annotation on the field level: @Export private static long dataAccessed
export it to the MBeans server using @Property on the field level: @Property private static long dataCreated;
I personally like the third option the most because it allows me to easily view the value of the variable from the VisualVM as well as show plotted historical values of it.
The first option, however, is the fastest as you can see the results on your screen just after you hit the “Start” button.
At this moment, the BTrace tab might not be visible as you probably need to install the appropriate plugin. Just go toTools->Plugins->Available Plugins and install the BTrace one.
Now if you once again open your application in VisualVM, the BTrace tab might still not be visible. If so, then you need to RMB click the application on the left hand side list and select “Trace application…” option as shown below:

The BTrace tab should be shown – choose it and you can type your BTrace script directly on the shown form. Just hit “Start” and your script will be weaved into the selected application.
Personally, I’d advise you to use the Open... button and select the BTrace script on your disk. In this way, every time you’ll edit the script source file, click “Trace application…” and proceed to the BTrace tab, the actual version of your script will be loaded.
If you’ve selected my exemplary application to be instrument and the provided BTrace script provided, just hit the “Start” button and the monitoring will start. You should see a bunch of information in the output window (“entry points” and “cache hits” messages) as shown in the below screenshot:

Note that one of the probe actions gathers the duration of the method execution and aggregates it using Aggregationclass. I’m using the aggregated values in a AVERAGE mode, so every 10 seconds, it’s printing the average method duration on the screen.
Of course replacing the 14207 with the PID you’ve read from the previous command. The-Djstat.showUnsupported=true is required to show your own defined counters.
Note that the name of the counter is not just the fully qualified name of the field – it’s prefixed with the btrace.
There is another way you can access the counter:
which will show you all counters for a given PID. You can further narrow the results using regular shell commands, e.g.:
the result should recall something like this:
If you’ve executed my source code and BTrace script, try to inspect the dataCreated value. You should see something like on the screen below:

If this key exists in the cache, we retrieve the data it holds and return.
If this key doesn’t exist in the cache, we create the data, save it in cache and return it.
So, basically, the above counter is not measuring cache hits but cache misses (every cache miss is followed by instantiation of the Data object and its insertion to the cache.)
After some time, we should have more and more hits to the cache, therefore less data should be created. You might expect that the Y axis value will finally get to the 100 and stay there till the application ends.
It’s true, but only if we’d use strong references. In the exemplary code I’ve used WeakReferences as discussed before. This means that we can observe more than 100 objects created, because after some time, the GC decides to move in and clear some of all our Data instances. It happens because they’re referenced only from the single point of the process and this only reference is weak.
This is what you can observe on the following screenshot:

Notice the point where the value of dataCreated is fairly constant; it means that almost no new Data is created, so we have many cache hits. Take a look at the memory consumption at the same point of time.
When the GC is cleaning up the memory, Data instances are garbage collected and we need to refill our cache (so we need to create a new Data objects). At the same point of time, we’ve got huge increase of dataCreated value.
You don’t have to wait for automatic GC but you can try hitting the “Perform GC” button in the “Monitor” tab to send a request for GC to be executed.
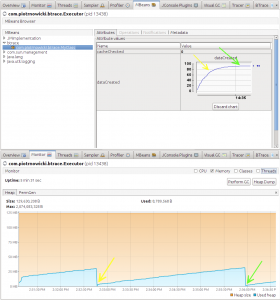
Note that we’re trying to reach a 100 created Data objects and we’re not going any further than this number. We’ve got many cache hits and this time, we’re not affected by the Garbage Collector actions (but they do occur as you can see in the graph.)
Don’t take the cacheChecked value under consideration at this point. This property is probed only when weak references are used.
If you use massive print statements, string concatenations, aggregations in your probe actions – it also doesn’t come without a cost. Notice that there is also an “Unsafe” checkbox in the BTrace tab. If you check it, you’re all by yourself andthere are many ways you can harm the performance and yourself.
It’s not the ultimate tool for Java monitoring. You might as well use other solutions already built in in your servlet container (like psi-probe) or application server (like SpringSource Insight).
Nevertheless, it’s a nice, low-level solution for monitoring any running Java application and it doesn’t require your source code to be executed in any specialized environment.
Did you like this? Share it:
Profiling, instrumentation or method measuring are great examples of cross-cutting concerns that might be nicely solved using AOP (Aspect Oriented Programming.) Basically, it allows you to invoke a certain action upon some defined conditions without the need for changing the instrumented code. The process of applying the aspects to your code is called weaving.
There are three types of weaving (not every AOP implementation must support all of them):
source code weaving (the aspect is applied to the inspected source code before the compilation),
byte code weaving (the aspect is applied to the compiled, .class file),
runtime weaving (the aspect is applied to the running, live application within the JVM).
As a side note, you can create your own simple runtime weaving AOP tool by using Java Agents that are invoked before any other written source code method (in the matter of fact, agent methods are invoked even before thestatic void main(String[] args) method of your Java class.)
Table of contents
What is the BTrace?
How Can I Use it?
Exemplary Source Code to be Instrumented
Why the WeakReference?
Exemplary BTrace Script
Ways of Getting the Results
Invoking the Script
JStat Counter Access
MBeans Access
Weak References and Garbage Collection
Strong References and Garbage Collection
Overhead
Summary
What is the BTrace?
One of the interesting tools for instrumenting your running applications is BTrace. It is a non-intrusive, read-only Java tool that allows you to create a script (compilable Java source code) that will be used to define probes and to monitor your running application (which I think is the same as the AOP runtime weaving).The big advantage of runtime weaving is that you are not forced to recompile the source code you want to instrument nor to have to stop it. You can just plug into already executed application and start monitoring it right away.
How Can I Use it?
Firstly, you need to execute your Java application that you want to monitor (well, there is a way to start an application and tracing at the same time, but you’ll need to read details on the BTrace website.) BTrace can be used in one of three ways:You can write the BTrace script and use btrace utility (it comes with the BTrace distribution) to apply your script to the running application,
You can write the BTrace script and compile it using BTrace provided compiler,
You can dynamically apply the BTrace script using the VisualVM.
I’ll focus on the third option, as in my opinion it seems to be the easiest and fastest. Nevertheless, one command that might be very useful for you despite the chosen method is the jps. It allows you to show what Java processes are currently running. The PID showed in the output will be useful in some of the further commands.
Exemplary Source Code to be Instrumented
At Github you can find an exemplary application that will be instrumented by the BTrace and discussed in the rest of this article. The source code should be pretty straightforward. The purpose of this application is very simple – it is supposed to simulate a cache access. The whole application consists of three classes:Data.java this is the data that will be stored in the cache; users will try to fetch it using the key which is a randomly generated integer number from range <0, 100):
package com.piotrnowicki.btrace; /** * Exemplary data that will be stored in the cache. The existence of * the Data makes sense only with some content; default constructor * is not provided. Use {@link Data#Data(String)} instead. * * @author PiotrNowicki * */ public class Data { private String content; public Data(String content) { this.content = content; } public String getContent() { return content; } }view raw
src/com/piotrnowicki/btrace/Data.java
DataAccessor.java is the main logic of the application. It stores a cache (map of weak references to Data objects) and allows clients to access its getData(-) method.
If the requested data is in the cache, it is retrieved and returned to the caller.
If it’s not in the cache, a new data is created, stored in the cache and returned to the caller:
package com.piotrnowicki.btrace; import java.lang.ref.WeakReference; import java.util.HashMap; import java.util.Map; import java.util.logging.Level; import java.util.logging.Logger; /** * This class is responsible for accessing the data stored in * the cache. * * @author PiotrNowicki * */ public class DataAccessor { private Logger log = Logger.getLogger(DataAccessor.class.getName()); /** * The cache for our {@link Data}. */ private Map<String, WeakReference<Data>> cache = new HashMap<String, WeakReference<Data>>(); /** * Accesses the {@link Data} stored in cache under given * <code>key</code>. If the data can't be found in the cache, it * <strong>creates</strong> a new instance of it. * * @param key * for the data we want to fetch. * * @return retrieved and cached data. */ public Data getData(String key) { log.log(Level.INFO, "Fetching data by key: {0}", key); Data result; WeakReference<Data> entry = cache.get(key); /* * It's a weak reference, so we need to check if it doesn't * store a null value. */ if (entry != null && entry.get() != null) { result = entry.get(); } else { // The content is not important for us for this example. result = new Data("Randomized content = " + Math.random()); cache.put(key, new WeakReference<Data>(result)); } return result; } }view raw
src/com/piotrnowicki/btrace/DataAccessor.java
Executor.java is the entry point for this application. It’s simulating a few hundreds data read access events, sleeping for a random time (0 – 1000 msec) between the requests:
package com.piotrnowicki.btrace; import java.util.Random; import java.util.logging.Level; import java.util.logging.Logger; import com.piotrnowicki.btrace.DataAccessor; /** * Main entry point for the application. Simulates multiple random * accesses to the cache. * * @author PiotrNowicki * */ public class Executor { private Logger log = Logger.getLogger(Executor.class.getName()); public static void main(String[] args) { new Executor().execute(); } /** * Simulates multiple cache access requests. */ void execute() { DataAccessor dataAccessor = new DataAccessor(); for (int i = 0; i < 1000; i++) { dataAccessor.getData(generateKey()); sleep(); } } /** * Helper method for random cache key generation. The number is * from the range <0, 100). * * @return generated key */ String generateKey() { return new Random().nextInt(100) + ""; } /** * Helper method for random sleep time generation. The sleep time * is from the range <0, 1000). * * @return generated sleep time */ long getSleepTime() { return new Double(Math.random() * 1000).longValue(); } /** * Helper method for making the current Thread go to sleep for * some time. */ void sleep() { long sleepTime = getSleepTime(); try { log.log(Level.INFO, "Going to sleep for {0} milliseconds", sleepTime); Thread.sleep(sleepTime); } catch (InterruptedException e) { // no-op for exemplary purpose } } }view raw
src/com/piotrnowicki/btrace/Executor.java
Why the WeakReference?
Take a look at the DataAccessor‘s cache – it’s stored in:Map<String, WeakReference<Data>> cache = new HashMap<String, WeakReference<Data>>();
The weak references are good for caching purposes as they are eligible for collecting by GC despite the fact they are still accessible from the map instance.
Note that the WeakHashMap wouldn’t be a good candidate for this purpose as it makes a weak references to the mapkeys, not values in which we’re interested in.
If you want to learn more about strong, soft, weak and phantom references please refer to Ethan Nicholas’s article.
Exemplary BTrace Script
Below you can find an exemplary BTrace script that will be used to instrument the previously presented source code / cache access. Some of the information is provided in the comments to the script code. You can create and edit the BTrace script in your IDE – just be sure that you have btrace-boot.jar on your classpath to be able to use the annotations like@OnMethod, @Property and so on.Beware that you are not allowed to use any non-BTrace methods nor to create new objects within the BTrace methods. The point is to guarantee that the script is read-only and as non-intrusive as possible, therefore you are not allowed to do e.g. String concatenations. You must use only methods from the BTraceUtils class that can provide you e.g. mentioned string concatenation, comparisons, aggregation, parsing methods, etc.
| 123456789101112131415161718192021222324252627282930313233343536373839404142434445464748495051525354555657585960616263646566676869707172737475767778798081828384858687888990919293949596979899100101102103104105106107108109110111 | package
com
.
piotrnowicki
.
btrace
;
import
static
com
.
sun
.
btrace
.
BTraceUtils
.
printArray
;
import
static
com
.
sun
.
btrace
.
BTraceUtils
.
println
;
import
static
com
.
sun
.
btrace
.
BTraceUtils
.
strcat
;
import
java.lang.ref.WeakReference
;
import
com.sun.btrace.AnyType
;
import
com.sun.btrace.BTraceUtils.Aggregations
;
import
com.sun.btrace.BTraceUtils.Strings
;
import
com.sun.btrace.aggregation.Aggregation
;
import
com.sun.btrace.aggregation.AggregationFunction
;
import
com.sun.btrace.annotations.BTrace
;
import
com.sun.btrace.annotations.Duration
;
import
com.sun.btrace.annotations.Export
;
import
com.sun.btrace.annotations.Kind
;
import
com.sun.btrace.annotations.Location
;
import
com.sun.btrace.annotations.OnMethod
;
import
com.sun.btrace.annotations.OnTimer
;
import
com.sun.btrace.annotations.ProbeClassName
;
import
com.sun.btrace.annotations.ProbeMethodName
;
import
com.sun.btrace.annotations.Property
;
import
com.sun.btrace.annotations.TargetMethodOrField
;
// @BTrace means that this class will be used to define probes
// and actions. All fields and methods must be static.
// You can use only BTraceUtils methods.
@BTrace
@SuppressWarnings
(
"unused"
)
public
class
CacheMonitorBTrace
{
// This field will be exported as a JStat counter.
@Export
private
static
long
dataAccessed
;
// This field will be exported to the MBean server.
@Property
private
static
long
dataCreated
;
@Property
private
static
long
cacheChecked
;
private
static
Aggregation
methodDuration
=
Aggregations
.
newAggregation
(
AggregationFunction
.
AVERAGE
);
/**
* We want to measure how long does the
* DataAcccesor#getData(-) method execution take.
*/
@OnMethod
(
clazz
=
"com.piotrnowicki.btrace.DataAccessor"
,
method
=
"getData"
,
location
=
@Location
(
Kind
.
RETURN
))
public
static
void
addMethodDuration
(
@Duration
long
duration
)
{
Aggregations
.
addToAggregation
(
methodDuration
,
duration
/
1000
);
dataAccessed
++;
}
/**
* Invoked whenever WeakReference#get(-) is invoked from the
* DataAccessor#getData(-) method.
*/
@OnMethod
(
clazz
=
"com.piotrnowicki.btrace.DataAccessor"
,
method
=
"getData"
,
location
=
@Location
(
value
=
Kind
.
CALL
,
clazz
=
"java.lang.ref.WeakReference"
,
method
=
"get"
))
public
static
void
cacheChecked
(
@TargetMethodOrField
(
fqn
=
true
)
String
method
)
{
println
(
strcat
(
"Cache check invoked; method: "
,
method
));
cacheChecked
++;
}
/**
* Invoked when any method from DataAccessor class is entered.
*/
@OnMethod
(
clazz
=
"com.piotrnowicki.btrace.DataAccessor"
,
method
=
"/.*/"
,
location
=
@Location
(
value
=
Kind
.
ENTRY
))
public
static
void
dataAccessorMethodEntry
(
@ProbeClassName
String
className
,
@ProbeMethodName
String
probeMethod
,
AnyType
[]
args
)
{
println
(
Strings
.
strcat
(
"Entered method: "
,
probeMethod
));
printArray
(
args
);
}
/**
* Invoked whenever new Data object is created from
* DataAccessor#getData(-) method.
*/
@OnMethod
(
clazz
=
"com.piotrnowicki.btrace.DataAccessor"
,
method
=
"getData"
,
location
=
@Location
(
value
=
Kind
.
NEW
,
clazz
=
"com.piotrnowicki.btrace.Data"
))
public
static
void
dataCreated
()
{
dataCreated
++;
}
/**
* Invoked every 10 seconds - not a real probe.
*/
@OnTimer
(
value
=
10000
)
public
static
void
printAvgMethodDuration
()
{
Aggregations
.
printAggregation
(
"Average method duration (ms)"
,
methodDuration
);
}
} |
CacheMonitorBTrace.java hosted with ❤ by
GitHub
All information about different probes locations as well as the requirements for the BTrace script methods and fields can be found here, so I won’t duplicate it.
However, I’ll try to explain what does the @OnMethod really do as it was quite unclear for me when I was writing the script.
Basically, all @OnMethod annotations define places where probes should be applied to the source code. The @Locationallows you to further narrow the probe location. So:
@OnMethod(clazz = "com.piotrnowicki.btrace.DataAccessor",
method = "getData",
location = @Location(Kind.RETURN))
public static void addMethodDuration(@Duration long duration)
means that when the control will return from the DataAccessor#getData(-) method’s body, the probe will be activated (body of the addMethodDuration method will be invoked.)
The Kind.Return is required when you want to use @Duration annotated argument. It’s quite reasonable – if you want to know how long did the method body take, you need to probe just before the return statement.
@OnMethod(clazz = "com.piotrnowicki.btrace.DataAccessor",
method = "getData",
location = @Location(value = Kind.CALL,
clazz = "java.lang.ref.WeakReference",
method = "get"))
public static void cacheCheckHit(
@TargetMethodOrField(fqn = true) String method)
means that we want to set a probe in DataAccessor#getData(-) method (clazz and method attributes) but we’re interested only in calls to the WeakReference#get(-) from within the DataAccessor#getData(-) method (locationattribute). Only when such call is made, the probe will be activated.
@OnMethod(clazz = "com.piotrnowicki.btrace.DataAccessor",
method = "/.*/",
location = @Location(value = Kind.ENTRY))
public static void dataAccessorMethodEntry(
@ProbeClassName String className,
@ProbeMethodName String probeMethod,
AnyType[] args)
means that we want to set a probe in any method within the DataAccessor class (clazz and method attributes) but we’re interested only in dependent methods entry events (location.)
@OnMethod(clazz = "com.piotrnowicki.btrace.DataAccessor",
method = "getData",
location = @Location(value = Kind.NEW,
clazz = "com.piotrnowicki.btrace.Data"))
public static void dataCreated()
means that we want to set a probe in DataAccessor#getData(-) method (clazz and method attributes) but the probe will be activated only upon instantiation of the Data objects within this method (location.)
Ways of Getting the Results
There are a couple of ways to get the results back from your probes. You can either:print it to the output using print(-) methods: println(Strings.strcat(“Entered method: “, probeMethod));
export the value to the jstat counter using @Export annotation on the field level: @Export private static long dataAccessed
export it to the MBeans server using @Property on the field level: @Property private static long dataCreated;
I personally like the third option the most because it allows me to easily view the value of the variable from the VisualVM as well as show plotted historical values of it.
The first option, however, is the fastest as you can see the results on your screen just after you hit the “Start” button.
Invoking the Script
If the application you will instrument is already running, you can run the VisualVM ($JAVA_HOME/bin/jvisualvm on the linux boxes) and find your application on the left hand side list. Double click it to inspect it (if you have never used the VisualVM – it’s a good time to see what information about running processes it provides.)At this moment, the BTrace tab might not be visible as you probably need to install the appropriate plugin. Just go toTools->Plugins->Available Plugins and install the BTrace one.
Now if you once again open your application in VisualVM, the BTrace tab might still not be visible. If so, then you need to RMB click the application on the left hand side list and select “Trace application…” option as shown below:

The BTrace tab should be shown – choose it and you can type your BTrace script directly on the shown form. Just hit “Start” and your script will be weaved into the selected application.
Personally, I’d advise you to use the Open... button and select the BTrace script on your disk. In this way, every time you’ll edit the script source file, click “Trace application…” and proceed to the BTrace tab, the actual version of your script will be loaded.
If you’ve selected my exemplary application to be instrument and the provided BTrace script provided, just hit the “Start” button and the monitoring will start. You should see a bunch of information in the output window (“entry points” and “cache hits” messages) as shown in the below screenshot:

Note that one of the probe actions gathers the duration of the method execution and aggregates it using Aggregationclass. I’m using the aggregated values in a AVERAGE mode, so every 10 seconds, it’s printing the average method duration on the screen.
JStat Counter Access
Besides the console output, you can observe the probe results of three other variables. One of them, dataAccessed, is exported as a jstat counter and can be accessed from a command line. For the provided example, type jps and locate your monitored application PID. Then type:jstat -J-Djstat.showUnsupported=true \ -name btrace.com.piotrnowicki.btrace.MyClass.dataAccessed 14207
Of course replacing the 14207 with the PID you’ve read from the previous command. The-Djstat.showUnsupported=true is required to show your own defined counters.
Note that the name of the counter is not just the fully qualified name of the field – it’s prefixed with the btrace.
There is another way you can access the counter:
jstat -J-Djstat.showUnsupported=true -snap 1420
which will show you all counters for a given PID. You can further narrow the results using regular shell commands, e.g.:
jstat -J-Djstat.showUnsupported=true -snap 14207|grep dataAccessed
the result should recall something like this:
btrace.com.piotrnowicki.btrace.MyClass.dataAccessed=189
MBeans Access
There are also two fields that are accessible through the MBeans server. Simply click on the MBeans tab in the VisualVM and expand the com.piotrnowicki.btrace.MyClass. You should see two properties: dataCreated and cacheChecked. After double-clicking on the value you can see a timeline – a historical values of the counter value plotted on the graph.If you’ve executed my source code and BTrace script, try to inspect the dataCreated value. You should see something like on the screen below:

Weak References and Garbage Collection
The above results actually depends on your JVM settings, but the point is: we create a random integer number from the range <0, 100) as a key for our cached data.If this key exists in the cache, we retrieve the data it holds and return.
If this key doesn’t exist in the cache, we create the data, save it in cache and return it.
So, basically, the above counter is not measuring cache hits but cache misses (every cache miss is followed by instantiation of the Data object and its insertion to the cache.)
After some time, we should have more and more hits to the cache, therefore less data should be created. You might expect that the Y axis value will finally get to the 100 and stay there till the application ends.
It’s true, but only if we’d use strong references. In the exemplary code I’ve used WeakReferences as discussed before. This means that we can observe more than 100 objects created, because after some time, the GC decides to move in and clear some of all our Data instances. It happens because they’re referenced only from the single point of the process and this only reference is weak.
This is what you can observe on the following screenshot:

Notice the point where the value of dataCreated is fairly constant; it means that almost no new Data is created, so we have many cache hits. Take a look at the memory consumption at the same point of time.
When the GC is cleaning up the memory, Data instances are garbage collected and we need to refill our cache (so we need to create a new Data objects). At the same point of time, we’ve got huge increase of dataCreated value.
You don’t have to wait for automatic GC but you can try hitting the “Perform GC” button in the “Monitor” tab to send a request for GC to be executed.
Strong References and Garbage Collection
Now, if we try to change the WeakReference to the strong reference and adjust the code so it works on Data instead ofWeakReference<data> the results will look like this:
Note that we’re trying to reach a 100 created Data objects and we’re not going any further than this number. We’ve got many cache hits and this time, we’re not affected by the Garbage Collector actions (but they do occur as you can see in the graph.)
Don’t take the cacheChecked value under consideration at this point. This property is probed only when weak references are used.
Overhead
The overhead of BTrace script should be minimal and that is one of the most important part of the project. It should be as non-intrusive and safe as possible. However, if you’re using e.g. the @Property annotation, you need to access the MBeans server so this is some additional overhead.If you use massive print statements, string concatenations, aggregations in your probe actions – it also doesn’t come without a cost. Notice that there is also an “Unsafe” checkbox in the BTrace tab. If you check it, you’re all by yourself andthere are many ways you can harm the performance and yourself.
Summary
The BTrace seems to be nice, fast and easy way to access and instrument your running Java application. It doesn’t require you to use any special tools — you can monitor every process on the JVM and thanks to the VisualVM plugin – you can change the script on-the-fly.It’s not the ultimate tool for Java monitoring. You might as well use other solutions already built in in your servlet container (like psi-probe) or application server (like SpringSource Insight).
Nevertheless, it’s a nice, low-level solution for monitoring any running Java application and it doesn’t require your source code to be executed in any specialized environment.
Did you like this? Share it:

相关文章推荐
- 【性能跟踪】btrace学习二--btrace一个简单例子
- 性能跟踪利器——Btrace
- BTrace使用简介
- BTrace简介及使用
- 开发工具系列(一):Btrace——线上Debug工具
- BTrace实现浅析
- HouseMD, 比BTrace更实用的Java运行诊断工具
- BTrace系列之三:BTrace实际案例分析
- Btrace入门到熟练小工完全指南
- 用btrace定位问题
- btrace-dtrace-for-java-ish
- 生产环境的调试神器Btrace
- 【性能跟踪】btrace学习三--bBTrace Annotation注解
- java动态跟踪分析工具BTrace实现原理
- btrace一些你不知道的事(源码入手)
- 线上排查工具btrace和jvm-inspector使用说明
- btrace 学习笔记
- BTrace使用简介
- Java性能分析工具Btrace
- BTrace系列之四:破解案例