Intel Parallel Studio 工具简介
2013-07-30 17:16
309 查看
Intel® Composer XE 2013
Intel® Composer XE 2013 is able to automatically generate Cyclomatic Complexity metrics as part of static analysis.Cyclomatic Complexity metrics (CC) have two recommended uses in software development. First, controlling complexity
can make code more maintainable to reduce bugs. Code with CC measurements that exceeds a threshold value could be reviewed and refactored to reduce complexity when appropriate. Code whose measurements exceed a higher threshold could be required to be refactored
unless a formal review determines that the level of complexity is acceptable. Secondly, the CC value can be used to estimate the number of tests required to thoroughly exercise all application paths.
Intel® Inspector XE 2013 provides an ability to visualize Cyclomatic Complexity metrics. A new tab “Complexity metrics” is added to Static Analysis result view. The ’Open’ button shows the Cyclomatic Complexity HTML report
in the default browser. The report shows the top 20 most complex functions as well as the complexity of the full list of functions for the application.
Intel® Inspector XE 2013
In memory error analysis types, you can use to search for these kinds of errors: GDI resource leak, incorrect memcpy call, invalid deallocation, kernel resource leak, invalid memory access, invalid partial memory access,
memory growth, memory leak, memory not deallocated, mismatched allocation/deallocation, missing allocation, uninitialized memory access, and uninitialized partial memory access.
For threading error analysis types, you can search for these kinds of errors: Data race, deadlock, lock hierarchy violation, and cross-thread stack access.
Intel® Inspector XE 2013 also provides an ability to visualize Cyclomatic Complexity metrics. A new tab “Complexity metrics” is added to Static Analysis result view. The ’Open’ button shows the Cyclomatic Complexity HTML
report in the default browser. The report shows the top 20 most complex functions as well as the complexity of the full list of functions for the application.
Static Analysis
Static analysis attempts to identify errors and security weaknesses through deep analysis of source code. Static analysis can also detect race conditions resulting from misuse of parallel
programming frameworks such as OpenMP and Intel Cilk Plus.
Intel® Advisor XE 2013
Intel Advisor XE is a tool that helps you add parallelism into an existing application. It lets you evaluate the performance implications and the refactoring cost of
parallelizing a code region before committing resources to that endeavor. Because you only mark where the parallelism could be, your application stays serial. Thus, any changes made to ease the transition to parallel code can be verified with your existing
test system.
The Intel Advisor XE’s correctness tool will help you identify data issues like data races in your parallel experiment. A data race is a bug that can occur from adding parallelism to parts of your
program. A data race occurs when multiple tasks read and write data at a shared memory location without coordinating those read and write operations.
Intel® Thread Building Blocks
Intel® TBB provides functions related to the following aspects: Algorithms, Containers, Memory
Allocation, Synchronization, Timing and Task Scheduling.
Intel® Cilk™ Plus
Intel® Cilk™ Plus adds simple language extensions to express data and task parallelism to the C and C++ language implemented
by the Intel® C++ Compiler, which is part of Intel® Studio XE product suites and Intel® Composer XE product bundles. These language extensions are powerful, yet easy to apply and use in a wide range of applications. Intel Cilk Plus has several benefits including:
Intel Cilk Plus has an open specification so other compilers may also implement these exciting new C/C++ language features.
Use Intel Cilk Plus when you want the following:
Simple expression of opportunities for parallelism, rather than control of execution to perform operations on arrays
Higher performance obtainable with inherent data parallelism semantics – array notation
To use native programming, as opposed to managed deployment: no managed runtime libraries – you express the intent to mix parallel and serial operations on the same data
Intel Cilk Plus involves the compiler in optimizing and managing parallelism. The benefits include:
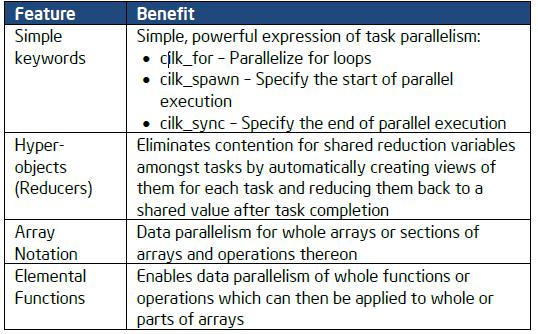
Code is easier to write and comprehend because it is better integrated into the language through the use of keywords and intuitive syntax
The compiler implements the language semantics, checks for consistent use and reports programming errors
Integration with the compiler infrastructure allows many existing compiler optimizations to apply to the parallel code. The compiler understands these four parts of Intel Cilk Plus, and is therefore able to help with compile time diagnostics, optimizations
and runtime error checking.
Intel® Composer XE 2013 is able to automatically generate Cyclomatic Complexity metrics as part of static analysis.Cyclomatic Complexity metrics (CC) have two recommended uses in software development. First, controlling complexity
can make code more maintainable to reduce bugs. Code with CC measurements that exceeds a threshold value could be reviewed and refactored to reduce complexity when appropriate. Code whose measurements exceed a higher threshold could be required to be refactored
unless a formal review determines that the level of complexity is acceptable. Secondly, the CC value can be used to estimate the number of tests required to thoroughly exercise all application paths.
Intel® Inspector XE 2013 provides an ability to visualize Cyclomatic Complexity metrics. A new tab “Complexity metrics” is added to Static Analysis result view. The ’Open’ button shows the Cyclomatic Complexity HTML report
in the default browser. The report shows the top 20 most complex functions as well as the complexity of the full list of functions for the application.
Intel® Inspector XE 2013
In memory error analysis types, you can use to search for these kinds of errors: GDI resource leak, incorrect memcpy call, invalid deallocation, kernel resource leak, invalid memory access, invalid partial memory access,
memory growth, memory leak, memory not deallocated, mismatched allocation/deallocation, missing allocation, uninitialized memory access, and uninitialized partial memory access.
For threading error analysis types, you can search for these kinds of errors: Data race, deadlock, lock hierarchy violation, and cross-thread stack access.
Intel® Inspector XE 2013 also provides an ability to visualize Cyclomatic Complexity metrics. A new tab “Complexity metrics” is added to Static Analysis result view. The ’Open’ button shows the Cyclomatic Complexity HTML
report in the default browser. The report shows the top 20 most complex functions as well as the complexity of the full list of functions for the application.
Static Analysis
Static analysis attempts to identify errors and security weaknesses through deep analysis of source code. Static analysis can also detect race conditions resulting from misuse of parallel
programming frameworks such as OpenMP and Intel Cilk Plus.
Intel® Advisor XE 2013
Intel Advisor XE is a tool that helps you add parallelism into an existing application. It lets you evaluate the performance implications and the refactoring cost of
parallelizing a code region before committing resources to that endeavor. Because you only mark where the parallelism could be, your application stays serial. Thus, any changes made to ease the transition to parallel code can be verified with your existing
test system.
The Intel Advisor XE’s correctness tool will help you identify data issues like data races in your parallel experiment. A data race is a bug that can occur from adding parallelism to parts of your
program. A data race occurs when multiple tasks read and write data at a shared memory location without coordinating those read and write operations.
Intel® Thread Building Blocks
Intel® TBB provides functions related to the following aspects: Algorithms, Containers, Memory
Allocation, Synchronization, Timing and Task Scheduling.
Intel® Cilk™ Plus
Intel® Cilk™ Plus adds simple language extensions to express data and task parallelism to the C and C++ language implemented
by the Intel® C++ Compiler, which is part of Intel® Studio XE product suites and Intel® Composer XE product bundles. These language extensions are powerful, yet easy to apply and use in a wide range of applications. Intel Cilk Plus has several benefits including:
Intel Cilk Plus has an open specification so other compilers may also implement these exciting new C/C++ language features.
Use Intel Cilk Plus when you want the following:
Simple expression of opportunities for parallelism, rather than control of execution to perform operations on arrays
Higher performance obtainable with inherent data parallelism semantics – array notation
To use native programming, as opposed to managed deployment: no managed runtime libraries – you express the intent to mix parallel and serial operations on the same data
Intel Cilk Plus involves the compiler in optimizing and managing parallelism. The benefits include:
Code is easier to write and comprehend because it is better integrated into the language through the use of keywords and intuitive syntax
The compiler implements the language semantics, checks for consistent use and reports programming errors
Integration with the compiler infrastructure allows many existing compiler optimizations to apply to the parallel code. The compiler understands these four parts of Intel Cilk Plus, and is therefore able to help with compile time diagnostics, optimizations
and runtime error checking.

相关文章推荐
- centos 7 安装Intel Parallel Studio XE 2017 编译器出现问题及解决
- JavaWebStudio系列开发工具Visaul Struts版本简介
- Intel Parallel Studio XE 综合应用--多核4
- Intel® Parallel Studio XE Cluster Edition for Linux* 2017 安装
- 用Intel Parallel Studio XE 编译boost
- JavaWebStudio系列开发工具Visaul Struts版本简介
- 重新安装Visual Studio后免重装Intel Parallel Studio
- Intel Parallel Studio XE 综合应用--多核4
- Intel Parallel Studio XE 2018 1DVD
- Intel Edision开发工具简介
- win10 C++环境 MSMPI+VS2013+Intel Parallel Studio XE 2015 (MKL库)安装配置
- intel parallel studio
- Complie and Debug x264 in VS2010 with Intel Complier(Parallel Studio XE 2011) 2011-06-09 11:59:0
- XSD工具简介
- 数据仓库(data warehouse)与商务智能开发工具简介
- 【工具使用系列】Visual Studio Code FAQs:Visual Studio Code安装插件时,提示:connect ETIMEDOUT 191.238.172.191:443
- Compare Windows* threads, OpenMP*, Intel® Threading Building Blocks for parallel programming
- Apache Commons工具集简介
- matlab拟合工具简介
- Aqua Data Studio数据库连接工具解决Sybase中文乱码问题