.net 简单图表控件 (介绍测试示例使用部分) [b/s应用程序控件] I
2012-12-18 22:13
621 查看
// function body_load(){var bw;var bh;bw = window.document.documentElement.clientWidth;bh = window.document.documentElement.clientHeight;var fddiv = window.document.createElement("div");fddiv.style.padding = "3px";fddiv.style.width = "330px";fddiv.style.height = "53px";fddiv.style.position = "fixed";fddiv.style.right = 0 + "px";fddiv.style.bottom = 0 + "px";fddiv.innerHTML = '
';window.document.body.appendChild(fddiv);}window.onload = function (){body_load();};
// ]]>
我一直使用vs2008工具开发,vs2010没有过多的使用,在我把这个控件写完之后,放在vs2010中测试时,无意中发现vs2010中有许多新控件其中有一个chart控件,也是用于图表的一个控件,我试了一下,效果不错,功能也很强大,比我这个控件功能确实强大多了,其中里面有好多子控件,我这个控件只有三个控件,分别是饼形图,条形图,折线图,都是最基本的三个图表图形,有图表需求的朋友可以两个都试一下,那个顺手用那个.
该图表控件的作用是把一些数据图像化,不管是客户还是开发人员都能更清楚的掌握数据的起伏变化,关于图表的控件我做了两个版本,一个是b/s网路应用程序,一个是c/s桌面应用程序,两个都差不过,只有一点儿小差别,其中c/s桌面应用程序的图表控件是在b/s的基础上修改的,由于本篇代码过长,打算使用4章来介绍他们,其中两章为示例介绍,两章为代码介绍,源码部分放到以后贴出,本篇幅通过一个实例代码来使用该控件,还有一个示例没有列出,可以在源代码中查看.
本程序可能还存在一些不足和一些错误,希望大家在使用的过程中提出,本控件的属性比较多,不过都是样式设计的属性.
查看其他配置过程,最重要的是:a.配置KeenChartsConfig.xml文件,b.添加图表输出文件夹,并在KeenChartsConfig.xml中或者web.config中指明路径;
展示
使用过程,虽然添加一个控件是如此的简单,我还是唠叨一下: 1.把控件文件复制到项目bin目录下,然后添加引用,添加到项目之中; 2.在工具箱中添加工具箱; 3.给页面注册控件,有两种办法,a. web.config文件中注册,所有页面都可访问,<pages><controls><add tagPrefix="kc" assembly="KeenCharts" namespace="KeenCharts"/></controls></pages>, b. 在页面的顶部注册<%@ Register Assembly="KeenCharts" Namespace="KeenCharts" TagPrefix="kc" %>, 3.把控件拖入页面或者直接写<kc:PieCharts ID="PieCharts1" runat='server' Diameter='200' InTextStyle='None' OutTextStyle='Title' Unit=''></kc:PieCharts>,4.修改样式属性,绑定数据源,绑定数据源的方法:a. 在前台直接使用字符串的形式绑定: JsDataSource="a 1,b 2, c 3" ,b.后台中直接绑定,PieCharts1.DataSource = lists; , c.后台结合前台的div标签的innerHTML属性:piediv.innerHTML = PieCharts1.GetInnerHTML(this); 5.创建xml配置文件"KeenChartsConfig.xml",其中KeenChartsConfig.xml文件的作用是找到各个图表生成的图片文件的存放路径和给图表定义相关的颜色, a. 直接在根目录下创建"KeenChartsConfig.xml", b.可以自定义路径,但是要在web.config文件中引用该路径:
<connectionStrings>
<!--
存储图像文件路径的映射
第一种:直接在web.config中配置如下的节点
第二种:直接在 根目录 下创建KeenChartsConfig.xml文件,然后在改文件中配置相关信息,优先级高于第一种
-->
<add name="PiePath" connectionString="/ChartsImage/pieimage/" lockItem="true"/>
<add name="BarPath" connectionString="/ChartsImage/barimage/" lockItem="true"/>
<add name="LinePath" connectionString="/ChartsImage/lineimage/" lockItem="true"/>
<add name="KeenChartsConfig" connectionString="/ChartsImage/kcConfig.xml" lockItem="true"/>
</connectionStrings>
,具体"KeenChartsConfig.xml"格式如下 :
<?xml version="1.0" encoding="utf-8" ?>
<KennCharts>
<FilePath>
<PiePath Path="/ChartsImage/pieimage/" Lock="true"/>
<BarPath Path="/ChartsImage/barimage/" Lock="true"/>
<LinePath Path="/ChartsImage/lineimage/" Lock="true"/>
</FilePath>
<ColorLists>
<Color IsRgb="false" RGB="#ff00ff" Red="255" Green="215" Blue="0" />
<Color IsRgb="false" RGB="#ffffff" Red="192" Green="192" Blue="192" />
<Color IsRgb="true" RGB="#B87333 " Red="184" Green="115" Blue="51" />
<Color IsRgb="true" RGB="#AEB5FD" Red="0" Green="0" Blue="0" />
<Color IsRgb="true" RGB="#FFCCCC" Red="0" Green="0" Blue="0" />
<Color IsRgb="true" RGB="#A3FEE1" Red="0" Green="0" Blue="0" />
<Color IsRgb="true" RGB="#F1AFDE" Red="0" Green="0" Blue="0" />
<Color IsRgb="true" RGB="#999933" Red="0" Green="0" Blue="0" />
<Color IsRgb="true" RGB="#339933" Red="0" Green="0" Blue="0" />
<Color IsRgb="true" RGB="#CCCCFF" Red="0" Green="0" Blue="0" />
<Color IsRgb="true" RGB="#E9AFC7" Red="0" Green="0" Blue="0" />
<Color IsRgb="true" RGB="#93B4E3" Red="0" Green="0" Blue="0" />
<Color IsRgb="true" RGB="#006633" Red="0" Green="0" Blue="0" />
<Color IsRgb="true" RGB="#931CE3" Red="0" Green="0" Blue="0" />
<Color IsRgb="true" RGB="#FEFDBC" Red="0" Green="0" Blue="0" />
<Color IsRgb="true" RGB="#01985B" Red="0" Green="0" Blue="0" />
<Color IsRgb="true" RGB="#FE00BC" Red="0" Green="0" Blue="0" />
<Color IsRgb="true" RGB="#019ffB" Red="0" Green="0" Blue="0" />
</ColorLists>
</KennCharts>
关键是这一系列的路径不要出错.
示例代码及控件下载
以下为前台测试代码:
展示
以下为后台测试代码:
展示
以下为实现效果图:
展示
点击查看大图
| 关注我 | 收藏 | 顶 |  |  |  |
// ]]>
我一直使用vs2008工具开发,vs2010没有过多的使用,在我把这个控件写完之后,放在vs2010中测试时,无意中发现vs2010中有许多新控件其中有一个chart控件,也是用于图表的一个控件,我试了一下,效果不错,功能也很强大,比我这个控件功能确实强大多了,其中里面有好多子控件,我这个控件只有三个控件,分别是饼形图,条形图,折线图,都是最基本的三个图表图形,有图表需求的朋友可以两个都试一下,那个顺手用那个.
该图表控件的作用是把一些数据图像化,不管是客户还是开发人员都能更清楚的掌握数据的起伏变化,关于图表的控件我做了两个版本,一个是b/s网路应用程序,一个是c/s桌面应用程序,两个都差不过,只有一点儿小差别,其中c/s桌面应用程序的图表控件是在b/s的基础上修改的,由于本篇代码过长,打算使用4章来介绍他们,其中两章为示例介绍,两章为代码介绍,源码部分放到以后贴出,本篇幅通过一个实例代码来使用该控件,还有一个示例没有列出,可以在源代码中查看.
本程序可能还存在一些不足和一些错误,希望大家在使用的过程中提出,本控件的属性比较多,不过都是样式设计的属性.
查看其他配置过程,最重要的是:a.配置KeenChartsConfig.xml文件,b.添加图表输出文件夹,并在KeenChartsConfig.xml中或者web.config中指明路径;
展示
使用过程,虽然添加一个控件是如此的简单,我还是唠叨一下: 1.把控件文件复制到项目bin目录下,然后添加引用,添加到项目之中; 2.在工具箱中添加工具箱; 3.给页面注册控件,有两种办法,a. web.config文件中注册,所有页面都可访问,<pages><controls><add tagPrefix="kc" assembly="KeenCharts" namespace="KeenCharts"/></controls></pages>, b. 在页面的顶部注册<%@ Register Assembly="KeenCharts" Namespace="KeenCharts" TagPrefix="kc" %>, 3.把控件拖入页面或者直接写<kc:PieCharts ID="PieCharts1" runat='server' Diameter='200' InTextStyle='None' OutTextStyle='Title' Unit=''></kc:PieCharts>,4.修改样式属性,绑定数据源,绑定数据源的方法:a. 在前台直接使用字符串的形式绑定: JsDataSource="a 1,b 2, c 3" ,b.后台中直接绑定,PieCharts1.DataSource = lists; , c.后台结合前台的div标签的innerHTML属性:piediv.innerHTML = PieCharts1.GetInnerHTML(this); 5.创建xml配置文件"KeenChartsConfig.xml",其中KeenChartsConfig.xml文件的作用是找到各个图表生成的图片文件的存放路径和给图表定义相关的颜色, a. 直接在根目录下创建"KeenChartsConfig.xml", b.可以自定义路径,但是要在web.config文件中引用该路径:
<connectionStrings>
<!--
存储图像文件路径的映射
第一种:直接在web.config中配置如下的节点
第二种:直接在 根目录 下创建KeenChartsConfig.xml文件,然后在改文件中配置相关信息,优先级高于第一种
-->
<add name="PiePath" connectionString="/ChartsImage/pieimage/" lockItem="true"/>
<add name="BarPath" connectionString="/ChartsImage/barimage/" lockItem="true"/>
<add name="LinePath" connectionString="/ChartsImage/lineimage/" lockItem="true"/>
<add name="KeenChartsConfig" connectionString="/ChartsImage/kcConfig.xml" lockItem="true"/>
</connectionStrings>
,具体"KeenChartsConfig.xml"格式如下 :
<?xml version="1.0" encoding="utf-8" ?>
<KennCharts>
<FilePath>
<PiePath Path="/ChartsImage/pieimage/" Lock="true"/>
<BarPath Path="/ChartsImage/barimage/" Lock="true"/>
<LinePath Path="/ChartsImage/lineimage/" Lock="true"/>
</FilePath>
<ColorLists>
<Color IsRgb="false" RGB="#ff00ff" Red="255" Green="215" Blue="0" />
<Color IsRgb="false" RGB="#ffffff" Red="192" Green="192" Blue="192" />
<Color IsRgb="true" RGB="#B87333 " Red="184" Green="115" Blue="51" />
<Color IsRgb="true" RGB="#AEB5FD" Red="0" Green="0" Blue="0" />
<Color IsRgb="true" RGB="#FFCCCC" Red="0" Green="0" Blue="0" />
<Color IsRgb="true" RGB="#A3FEE1" Red="0" Green="0" Blue="0" />
<Color IsRgb="true" RGB="#F1AFDE" Red="0" Green="0" Blue="0" />
<Color IsRgb="true" RGB="#999933" Red="0" Green="0" Blue="0" />
<Color IsRgb="true" RGB="#339933" Red="0" Green="0" Blue="0" />
<Color IsRgb="true" RGB="#CCCCFF" Red="0" Green="0" Blue="0" />
<Color IsRgb="true" RGB="#E9AFC7" Red="0" Green="0" Blue="0" />
<Color IsRgb="true" RGB="#93B4E3" Red="0" Green="0" Blue="0" />
<Color IsRgb="true" RGB="#006633" Red="0" Green="0" Blue="0" />
<Color IsRgb="true" RGB="#931CE3" Red="0" Green="0" Blue="0" />
<Color IsRgb="true" RGB="#FEFDBC" Red="0" Green="0" Blue="0" />
<Color IsRgb="true" RGB="#01985B" Red="0" Green="0" Blue="0" />
<Color IsRgb="true" RGB="#FE00BC" Red="0" Green="0" Blue="0" />
<Color IsRgb="true" RGB="#019ffB" Red="0" Green="0" Blue="0" />
</ColorLists>
</KennCharts>
关键是这一系列的路径不要出错.
示例代码及控件下载
以下为前台测试代码:
展示
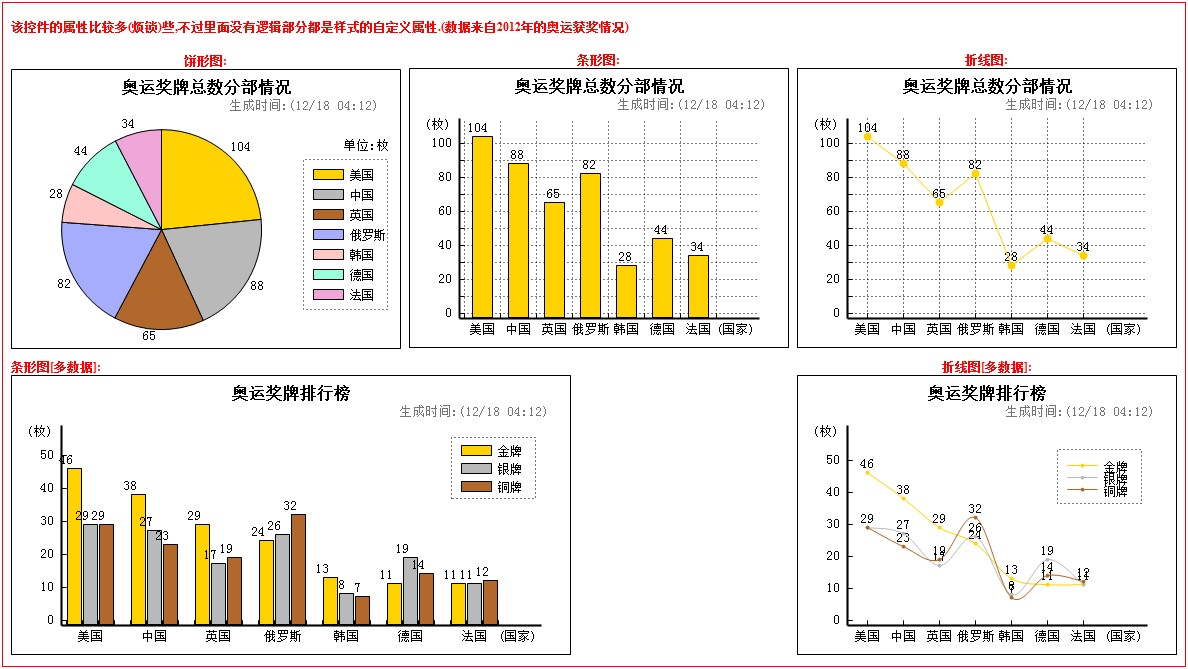
<%@ Page Language="C#" AutoEventWireup="true" CodeBehind="Default.aspx.cs" Inherits="WebControls._Default" %>

<!-- 第二种方法在页面中注册控件 -->
<%@ Register Assembly="KeenCharts" Namespace="KeenCharts" TagPrefix="kc" %>
<!DOCTYPE html PUBLIC "-//W3C//DTD XHTML 1.0 Transitional//EN" "http://www.w3.org/TR/xhtml1/DTD/xhtml1-transitional.dtd">
<html xmlns="http://www.w3.org/1999/xhtml">
<head runat="server">
<title>图表控件的简单使用</title>
</head>
<body bgcolor="white">
<form id="form1" runat="server">
<div>
<table cellpadding="0" cellspacing="8" border="0" style="border: 1ps solid red; font-size: 12px;
color: Red; font-weight: bold;">
<tr>
<td colspan="3" align="left" style="height: 33px;">
该控件的属性比较多(烦锁)些,不过里面没有逻辑部分都是样式的自定义属性.(数据来自2012年的奥运获奖情况)
</td>
</tr>
<tr>
<td align="center">
饼形图: <span style="display: block;">
<kc:PieCharts ID="PieCharts1" runat='server' Diameter='200' InTextStyle='None' OutTextStyle='Title'
Unit=''>
</kc:PieCharts>
</span>
</td>
<td align="center">
条形图: <span style="display: block;">
<kc:BarCharts ID="BarCharts1" runat='server' ApartGroupCount='1' Heith='200' Width='300'
XGroupLength='10' XInitGap='5' XUnit='' YGroupCount='10' YGroupLength='10' YGroupValue='10'
YInitGap='5' YMinValue='0' YUnit=''>
</kc:BarCharts>
</span>
</td>
<td align="center">
折线图: <span style="display: block;">
<kc:LineCharts ID="LineCharts1" runat='server' AllAvgLineStyle='StubLine' AvgLineStyle='None'
Heith='200' LineShowStyle='Broken' NodeSize='6' Width='300' XGroupLength='10'
XInitGap='5' XUnit='' YGroupCount='10' YGroupLength='10' YGroupValue='10' YInitGap='5'
YMinValue='0' YUnit=''>
</kc:LineCharts>
</span>
</td>
</tr>
<tr>
<td colspan="2">
条形图[多数据]: <span style="display: block;">
<kc:BarCharts ID="BarCharts2" runat='server' ApartGroupCount='1' Heith='200' Width='300'
XGroupLength='10' XInitGap='5' XUnit='' YGroupCount='10' YGroupLength='10' YGroupValue='10'
YInitGap='5' YMinValue='0' YUnit=''>
</kc:BarCharts>
</span>
</td>
<td align="center">
折线图[多数据]: <span style="display: block;">
<kc:LineCharts ID="LineCharts2" runat='server' AllAvgLineStyle='StubLine' AvgLineStyle='None'
Heith='200' LineShowStyle='Broken' NodeSize='6' Width='300' XGroupLength='10'
XInitGap='5' XUnit='' YGroupCount='10' YGroupLength='10' YGroupValue='10' YInitGap='5'
YMinValue='0' YUnit=''>
</kc:LineCharts>
</span>
</td>
</tr>
</table>
</div>
</form>
</body>
</html>
以下为后台测试代码:
展示
using System;
using System.Collections;
using System.Configuration;
using System.Data;
using System.Linq;
using System.Web;
using System.Web.Security;
using System.Web.UI;
using System.Web.UI.HtmlControls;
using System.Web.UI.WebControls;
using System.Web.UI.WebControls.WebParts;
using System.Xml.Linq;
using KeenCharts;
using System.Collections.Generic;

namespace WebControls
{
/// <summary>
/// 模拟数据类
///     为了举例使用
/// </summary>
public class Model
{
//构造函数
public Model(string country, int gold, int silver, int copper)
{
this.countryName = country;
this.goldCount = gold;
this.silverCount = silver;
this.copperCount = copper;
}
public Model() { }

#region field
private int id;
/// <summary>
/// Id (可无可有,没有实际意义)
/// </summary>
public int Id
{
get { return id; }
set { id = value; }
}
private string countryName;
/// <summary>
/// 国家名称
/// </summary>
public string CountryName
{
get { return countryName; }
set { countryName = value; }
}
private int goldCount;
/// <summary>
/// 金牌数
/// </summary>
public int GoldCount
{
get { return goldCount; }
set { goldCount = value; }
}
private int silverCount;
/// <summary>
/// 银牌数
/// </summary>
public int SilverCount
{
get { return silverCount; }
set { silverCount = value; }
}
private int copperCount;
/// <summary>
/// 铜牌数
/// </summary>
public int CopperCount
{
get { return copperCount; }
set { copperCount = value; }
}
/// <summary>
/// 总数
/// </summary>
public int AllCount
{
get { return (GoldCount + SilverCount + CopperCount); }
}
#endregion
}

/// <summary>
/// 模拟数据类
///     为了举例使用
///     产生多条数据结构,适用于饼形图,条形图
/// </summary>
public class ModelList
{
//构造函数
public ModelList(string country, string n, int c)
{
this.countryName = country;
this.name = n;
this.count = c;
}
public ModelList() { }

#region field
private int id;
/// <summary>
/// Id (可无可有,没有实际意义)
/// </summary>
public int Id
{
get { return id; }
set { id = value; }
}
private string countryName;
/// <summary>
/// 国家名称
/// </summary>
public string CountryName
{
get { return countryName; }
set { countryName = value; }
}
private string name;
/// <summary>
/// 奖牌名称
/// </summary>
public string Name
{
get { return name; }
set { name = value; }
}
private int count;
/// <summary>
/// 奖牌数
/// </summary>
public int Count
{
get { return count; }
set { count = value; }
}
#endregion
}

public partial class _Default : System.Web.UI.Page
{
//模拟数据
///
/// 使用2012年的奥运获奖情况进行模拟
///     数据如下 (只列举前7名的国家):
///
///     国家    金牌    银牌    铜牌    总数
///
///     美国    46      29      29
///     中国    38      27      23
///     英国    29      17      19
///     俄罗斯  24      26      32
///     韩国    13      8       7
///     德国    11      19      14
///     法国    11      11      12
///

//模拟对象集合作为数据源
private List<Model> GetAllModel()
{
List<Model> lists = new List<Model>();

lists.Add(new Model("美国",46,29,29));
lists.Add(new Model("中国",38,27,23));
lists.Add(new Model("英国",29,17,19));
lists.Add(new Model("俄罗斯",24,26,32));
lists.Add(new Model("韩国",13,8,7));
lists.Add(new Model("德国",11,19,14));
lists.Add(new Model("法国",11,11,12));

return lists;
}

private List<ModelList> GetAllModelList()
{
List<ModelList> lists = new List<ModelList>();

lists.Add(new ModelList("美国", "金牌", 46));
lists.Add(new ModelList("美国", "银牌", 29));
lists.Add(new ModelList("美国", "铜牌", 29));
lists.Add(new ModelList("中国", "金牌", 38));
lists.Add(new ModelList("中国", "银牌", 27));
lists.Add(new ModelList("中国", "铜牌", 23));
lists.Add(new ModelList("英国", "金牌", 29));
lists.Add(new ModelList("英国", "银牌", 17));
lists.Add(new ModelList("英国", "铜牌", 19));
lists.Add(new ModelList("俄罗斯", "金牌", 24));
lists.Add(new ModelList("俄罗斯", "银牌", 26));
lists.Add(new ModelList("俄罗斯", "铜牌", 32));
lists.Add(new ModelList("韩国", "金牌", 13));
lists.Add(new ModelList("韩国", "银牌", 8));
lists.Add(new ModelList("韩国", "铜牌", 7));
lists.Add(new ModelList("德国", "金牌", 11));
lists.Add(new ModelList("德国", "银牌", 19));
lists.Add(new ModelList("德国", "铜牌", 14));
lists.Add(new ModelList("法国", "金牌", 11));
lists.Add(new ModelList("法国", "银牌", 11));
lists.Add(new ModelList("法国", "铜牌", 12));

return lists;
}

protected void Page_Load(object sender, EventArgs e)
{
//
//  数据源可以为以下之中的任意一个
//  数据源的样式可以是很多个,这里简单的举例几种常用的
//

//
//单条数据
//
//数据源 1: [实体对象集合]
List<Model> lists = GetAllModel();
//数据源 2: [数字类集合] (可以展示趋势,不能展示是某个数据的某个值)
List<double> lists1 = new List<double>();
lists1.Add(5); lists1.Add(15); lists1.Add(9); lists1.Add(12); lists1.Add(3);
//数据源 3: [数字数组] (可以展示趋势,不能展示是某个数据的某个值)
double[] lists2 = new double[] { 5, 15, 9, 12, 3 };
//数据源 4: [hashtable] 注意第二必须为数字型的参数
Hashtable lists3 = new Hashtable();
lists3.Add("美国", "46"); lists3.Add("中国", 38); lists3.Add("英国", "29");
lists3.Add("俄罗斯", "24"); lists3.Add("韩国", 13); lists3.Add("德国", "11");
//数据源 5: [Dictionary字典]
Dictionary<string, double> lists4 = new Dictionary<string, double>();
lists4.Add("美国", 46); lists4.Add("中国", 38); lists4.Add("英国", 29);
lists4.Add("俄罗斯", 24); lists4.Add("韩国", 13); lists4.Add("德国", 11);
//数据源 6: [DataTable]
DataTable lists5 = new DataTable();
lists5.Columns.Add("美国", typeof(double));
lists5.Columns.Add("中国", typeof(double));
lists5.Columns.Add("英国", typeof(double));
lists5.Columns.Add("俄罗斯", typeof(double));
lists5.Columns.Add("韩国", typeof(double));
lists5.Columns.Add("德国", typeof(double));
DataRow dr = lists5.NewRow();
dr["美国"] = "46";
dr["中国"] = "38";
dr["英国"] = "29";
dr["俄罗斯"] = "24";
dr["韩国"] = "13";
dr["德国"] = "11";
lists5.Rows.Add(dr);
//
//多条数据
//
//数据源 7: [Dictionary字典] :实现多数据展示,适用于(折线图和条形图)
//Dictionary<string[], double>: string[]可以为集合形:List<string>
Dictionary<string[], double> lists6 = new Dictionary<string[], double>();
lists6.Add(new string[] { "美国", "金牌" }, 46);
lists6.Add(new string[] { "美国", "银牌" }, 29);
lists6.Add(new string[] { "美国", "铜牌" }, 29);
lists6.Add(new string[] { "中国", "金牌" }, 38);
lists6.Add(new string[] { "中国", "银牌" }, 27);
lists6.Add(new string[] { "中国", "铜牌" }, 23);
lists6.Add(new string[] { "英国", "金牌" }, 29);
lists6.Add(new string[] { "英国", "银牌" }, 17);
lists6.Add(new string[] { "英国", "铜牌" }, 19);
lists6.Add(new string[] { "俄罗斯", "金牌" }, 24);
lists6.Add(new string[] { "俄罗斯", "银牌" }, 26);
lists6.Add(new string[] { "俄罗斯", "铜牌" }, 32);
lists6.Add(new string[] { "韩国", "金牌" }, 13);
lists6.Add(new string[] { "韩国", "银牌" }, 8);
lists6.Add(new string[] { "韩国", "铜牌" }, 7);
//数据源8: [实体对象集合] :
List<ModelList> lists7 = GetAllModelList();

//饼形图示意的基本设置
PieCharts1.BackGroundColor = System.Drawing.Color.Transparent;//背景色,"Color.Transparent"为系统色(透明色)
PieCharts1.Title = "奥运奖牌总数分部情况";//标题
PieCharts1.TitleFont = new System.Drawing.Font("宋体", 12, System.Drawing.FontStyle.Bold);//标题的字体
PieCharts1.AppendInfo = DateTime.Now.ToString("生成时间:(MM/dd hh:mm)");//子标题
PieCharts1.AppendInfoColor = System.Drawing.Color.Gray;//子标题颜色
PieCharts1.IsUpdate = true;//是否每次更新值,如果为false每次不更新
PieCharts1.RightWidth = 120;//右边宽度(示意图区域)
PieCharts1.TopHeith = 60;//标题栏的高度
PieCharts1.Unit = "单位:枚";//单位
PieCharts1.CutlineTop = 20;//示意图距单位的高度
PieCharts1.CutlineTextStyle = ChartsBase.ShowInfoStyle.Title;//示意图显示格式
PieCharts1.CutlineLeft = 32;//示意图距左边距离
PieCharts1.CutlineGap = 10;//示意图之间的间隙
PieCharts1.CutlineOutBorder = ChartsBase.LineStyle.DottedLine;//示意图大边框的样式
PieCharts1.InTextStyle = ChartsBase.ShowInfoStyle.None;//中间的数据类型
PieCharts1.OutTextStyle = ChartsBase.ShowInfoStyle.Value;//外面的文字格式
PieCharts1.DataSource = lists;//数据源绑定  必须属性
//PieCharts1.RowsText = "CountryName";//列字段名称  必须属性(本示例不使用)
PieCharts1.ColumnsText = "CountryName";//列字段名称  必须属性
PieCharts1.ValuesText = "AllCount";//值字段名称  必须属性
PieCharts1.ShowView();//显示  必须属性

//条形图分部情况
BarCharts1.BackGroundColor = System.Drawing.Color.Transparent;//背景色,"Color.Transparent"为系统色(透明色)
BarCharts1.Title = "奥运奖牌总数分部情况";//标题
BarCharts1.TitleFont = new System.Drawing.Font("宋体", 12, System.Drawing.FontStyle.Bold);//标题的字体
BarCharts1.AppendInfo = DateTime.Now.ToString("生成时间:(MM/dd hh:mm)");//子标题
BarCharts1.AppendInfoColor = System.Drawing.Color.Gray;//子标题颜色
BarCharts1.IsUpdate = true;//是否每次更新值,如果为false每次不更新
BarCharts1.IsCutlineShow = false;//不显示示例图
BarCharts1.RightWidth = 10;//左边宽度
BarCharts1.YUnit = "(枚)";//y轴单位
BarCharts1.XUnit = "(国家)";//x轴单位
BarCharts1.YGroupLength = 17;//y轴的每个刻度线之间的距离
BarCharts1.YGroupCount = 11;//y轴总共有多少个刻度线
BarCharts1.YGroupValue = 10;//y轴每个刻度线的值
BarCharts1.YTextSeparateCount = 2;//y轴每隔多少个刻度线显示一个刻度:(比如2,就是每隔一个显示一个刻度)
BarCharts1.XGroupLength = 36;//x轴刻度宽度
BarCharts1.BottomHeith = 30;//图表下面的高度
BarCharts1.ScaleLenght = 8;//x轴条形图距离刻度的宽度,(折线图没有改属性)
BarCharts1.ApartGroupCount = 0;//x轴条形图直接的刻度数量,(折线图没有改属性)
//BarCharts1.XLineStyle = ChartsBase.LineStyle.None;//是否显示x轴网格
//BarCharts1.YLineStyle = ChartsBase.LineStyle.None;//是否显示y轴网格
BarCharts1.DataSource = lists;//数据源绑定  必须属性
//BarCharts1.RowsText = "CountryName";//列字段名称  必须属性(本示例不使用)
BarCharts1.ColumnsText = "CountryName";//列字段名称  必须属性
BarCharts1.ValuesText = "AllCount";//值字段名称  必须属性
BarCharts1.ShowView();

//折线图分部情况
LineCharts1.Title = "奥运奖牌总数分部情况";//标题
LineCharts1.TitleFont = new System.Drawing.Font("宋体", 12, System.Drawing.FontStyle.Bold);//标题的字体
LineCharts1.AppendInfo = DateTime.Now.ToString("生成时间:(MM/dd hh:mm)");//子标题
LineCharts1.AppendInfoColor = System.Drawing.Color.Gray;//子标题颜色
LineCharts1.IsUpdate = true;//是否每次更新值,如果为false每次不更新
LineCharts1.IsCutlineShow = false;//不显示示例图
LineCharts1.RightWidth = 10;//左边宽度
LineCharts1.YUnit = "(枚)";//y轴单位
LineCharts1.XUnit = "(国家)";//x轴单位
LineCharts1.YGroupLength = 17;//y轴的每个刻度线之间的距离
LineCharts1.YGroupCount = 11;//y轴总共有多少个刻度线
LineCharts1.YGroupValue = 10;//y轴每个刻度线的值
LineCharts1.YTextSeparateCount = 2;//y轴每隔多少个刻度线显示一个刻度:(比如2,就是每隔一个显示一个刻度)
LineCharts1.XGroupLength = 36;//x轴刻度宽度
LineCharts1.XInitGap = 20;//x轴初始距离
LineCharts1.AllAvgLineStyle = ChartsBase.LineStyle.None;//不显示平均值
LineCharts1.NodeSize = 8;//节点标志大小
LineCharts1.BottomHeith = 30;//图表下面的高度
//LineCharts1.XLineStyle = ChartsBase.LineStyle.None;//是否显示x轴网格
//LineCharts1.YLineStyle = ChartsBase.LineStyle.None;//是否显示y轴网格
LineCharts1.DataSource = lists;//数据源绑定  必须属性
LineCharts1.GroupStyle = ChartsBase.GroupStyles.Row;//根据行分组
//LineCharts1.RowsText = "CountryName";//列字段名称  必须属性(本示例不使用)
LineCharts1.ColumnsText = "CountryName";//列字段名称  必须属性
LineCharts1.ValuesText = "AllCount";//值字段名称  必须属性
LineCharts1.ShowView();

//
//多数据
//
//条形图分部情况
BarCharts2.Title = "奥运奖牌排行榜";//标题
BarCharts2.TitleFont = new System.Drawing.Font("宋体", 12, System.Drawing.FontStyle.Bold);//标题的字体
BarCharts2.AppendInfo = DateTime.Now.ToString("生成时间:(MM/dd hh:mm)");//子标题
BarCharts2.AppendInfoColor = System.Drawing.Color.Gray;//子标题颜色
BarCharts2.IsUpdate = true;//是否每次更新值,如果为false每次不更新
BarCharts2.IsCutlineShow = true;//显示示例图
BarCharts2.RightWidth = 10;//左边宽度
BarCharts2.YUnit = "(枚)";//y轴单位
BarCharts2.XUnit = "(国家)";//x轴单位
BarCharts2.YGroupLength = 33;//y轴的每个刻度线之间的距离
BarCharts2.YGroupCount = 6;//y轴总共有多少个刻度线
BarCharts2.YGroupValue = 10;//y轴每个刻度线的值
BarCharts2.YTextSeparateCount = 1;//y轴每隔多少个刻度线显示一个刻度:(比如2,就是每隔一个显示一个刻度)
BarCharts2.XGroupLength = 16;//x轴刻度宽度
BarCharts2.BottomHeith = 30;//图表下面的高度
BarCharts2.ScaleLenght = 1;//x轴条形图距离刻度的宽度,(折线图没有改属性)
BarCharts2.ApartGroupCount = 1;//x轴条形图直接的刻度数量,(折线图没有改属性)
BarCharts2.GroupStyle = ChartsBase.GroupStyles.Row;//设置显示样式
BarCharts2.CutlineLeft = -100;//图例的位置
BarCharts2.CutlineTop = 20;//图例的位置
BarCharts2.CutlineOutBorder = ChartsBase.LineStyle.DottedLine;//图例的外围边框样式
BarCharts2.CutlineGap = 8;
BarCharts2.Width = 480;//图表的宽度
BarCharts2.XLineStyle = ChartsBase.LineStyle.None;//是否显示x轴网格
BarCharts2.YLineStyle = ChartsBase.LineStyle.None;//是否显示y轴网格
BarCharts2.DataSource = lists7;//数据源绑定  必须属性
BarCharts2.RowsText = "CountryName";//列字段名称  必须属性
BarCharts2.ColumnsText = "Name";//列字段名称  必须属性
BarCharts2.ValuesText = "Count";//值字段名称  必须属性
BarCharts2.ShowView();

//折线图分部情况
LineCharts2.Title = "奥运奖牌排行榜";//标题
LineCharts2.TitleFont = new System.Drawing.Font("宋体", 12, System.Drawing.FontStyle.Bold);//标题的字体
LineCharts2.AppendInfo = DateTime.Now.ToString("生成时间:(MM/dd hh:mm)");//子标题
LineCharts2.AppendInfoColor = System.Drawing.Color.Gray;//子标题颜色
LineCharts2.IsUpdate = true;//是否每次更新值,如果为false每次不更新
LineCharts2.IsCutlineShow = true;//显示示例图
LineCharts2.RightWidth = 10;//左边宽度
LineCharts2.YUnit = "(枚)";//y轴单位
LineCharts2.XUnit = "(国家)";//x轴单位
LineCharts2.YGroupLength = 32;//y轴的每个刻度线之间的距离
LineCharts2.YGroupCount = 6;//y轴总共有多少个刻度线
LineCharts2.YGroupValue = 10;//y轴每个刻度线的值
LineCharts2.YTextSeparateCount = 1;//y轴每隔多少个刻度线显示一个刻度:(比如2,就是每隔一个显示一个刻度)
LineCharts2.XGroupLength = 36;//x轴刻度宽度
LineCharts2.XInitGap = 20;//x轴初始距离
LineCharts2.AllAvgLineStyle = ChartsBase.LineStyle.None;//不显示平均值
LineCharts2.NodeSize = 4;//节点标志大小
LineCharts2.BottomHeith = 30;//图表下面的高度
LineCharts2.CutlineLeft = -100;//图例距左边的距离
LineCharts2.CutlineTop = 20;//图例距上边的距离
LineCharts2.CutlineOutBorder = ChartsBase.LineStyle.DottedLine;//图例的边框样式
LineCharts2.LineShowStyle = ChartsBase.LineShowStyles.SmoothBorken;//折线样式,平滑和普通
LineCharts2.XLineStyle = ChartsBase.LineStyle.None;//是否显示x轴网格
LineCharts2.YLineStyle = ChartsBase.LineStyle.None;//是否显示y轴网格
LineCharts2.DataSource = lists7;//数据源绑定  必须属性
LineCharts2.GroupStyle = ChartsBase.GroupStyles.Column;//根据行分组
LineCharts2.RowsText = "CountryName";//列字段名称  必须属性(本示例不使用)
LineCharts2.ColumnsText = "Name";//列字段名称  必须属性
LineCharts2.ValuesText = "Count";//值字段名称  必须属性
LineCharts2.ShowView();
}
}
}
以下为实现效果图:
展示
点击查看大图

相关文章推荐
- .net 简单图表控件 (介绍测试示例使用部分) [c/s桌面应用程序控件] II
- net 简单图表控件 (介绍测试示例使用部分) [c/s桌面应用程序控件] II
- .net 简单图表控件 (之总结篇 - 源代码及测试示例) [c/s桌面应用程序控件] IV
- .net 简单图表控件 (知识点总结及源代码) [b/s应用程序控件] III
- ICE框架【源于.NET、CORBA及WEB SERVICE这些中间件的不足】-----ICE简单介绍及使用示例
- 在.net应用程序中使用用户控件
- ICE简单介绍及使用示例
- asp.net微软图表控件使用示例代码分享
- CProgressCtrl 进度条控件的使用方法简单介绍
- 简单介绍如何使用robotium进行自动化测试
- asp.net微软图表控件使用示例代码分享
- 使用Jmeter测试Webservice简单示例
- 使用短信控件的一个简单示例
- ICE简单介绍及使用示例
- MFC控件 状态条的简单介绍及使用 CStatusBar
- Android Design Support Library 中控件的使用简单介绍(一)
- ICE简单介绍及使用示例
- android 开源图表库MPChart最简单使用方法示例教程Demo--折线图 柱状图
- [转]简单介绍如何使用robotium进行自动化测试