F#图表之FSharpChart
2012-08-03 15:52
190 查看
FSharpChart是类型System.Windows.Forms.DataVisualization.Charting的F#友好包装, 使之可以再F# Interactive 中交互表现数据。FSharpChart的最新版本是FSharpChart0.6,是微软的Carl Nolan's提供的。在MSDN的Chart Controls章节里可以浏览到更多FChart Controls的相关信息。当然有关FSharpChart的更多的信息,你也可以亲自去浏览Carl Nolan’s的博客。
最新版本的提供了,以下新的功能:
剪切板的另存为功能
属性改变事件
支持3D图表
BoxPlot图表的数据命名
在这之前需要新建一个F#的应用程序项目,添加对以下DLL的引用:
System.Windows.Forms.dll
System.Drawing.dll
System.Windows.Forms.DataVisualization.dll
WindowsFormsIntegration.dll
由于我想使用WPF(Windows Presentation Foundation)来承载Chart,所以需要对以下DLL的引用(我的另一篇文章有比较详细的过程描述):
System.Core.dll
System.Xaml.dl
PresentationCore.dll
PresentationFramework.dll
FSharpChart本质上是属于WinForm的控件,所以在WPF中要用WindowsFormsHost来承载。
一 , 基本功能
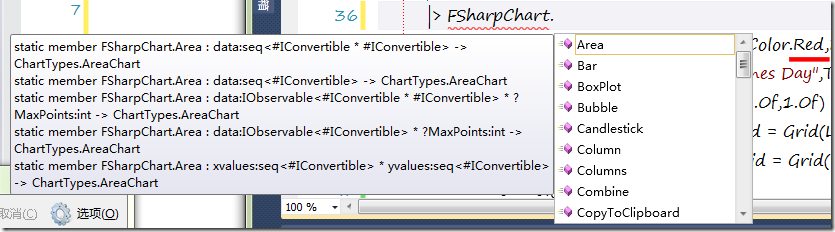
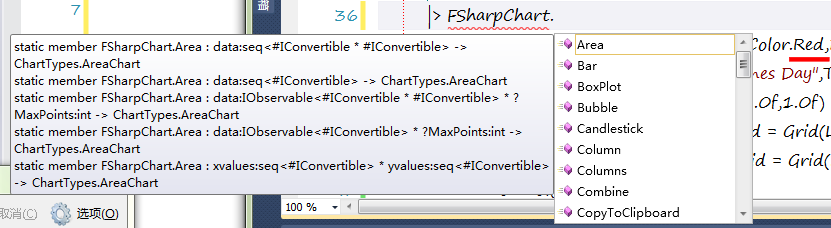
FSharpChart支持System.Windows.Forms.DataVisualization.Charting命名控件你的所有类型。通过使用FSharpChart类型的静态方法创建所有的chart类型,并且可以再智能感知浏览,如下图所示:
这些方法在chart上显示数据变得更加容易。
如:
将以下图形包装为ChartControl控件:
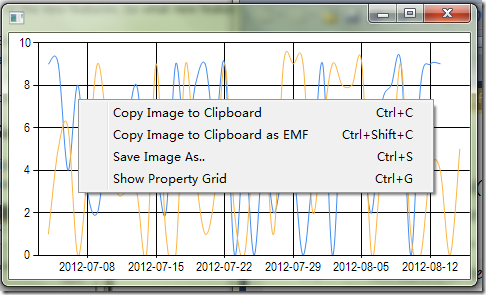
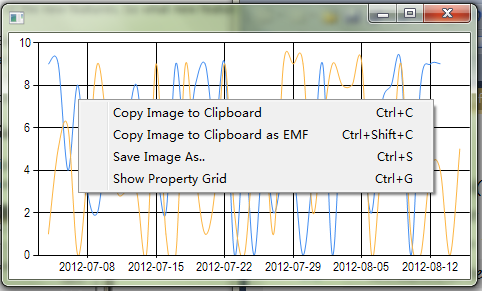
每一个chart控件都有一个context menu菜单,可以轻松将chart复制到剪切板,保存为文件,查看(或者修改)详细的chart属性。
在一个Chart画两条曲线(组合其他图形的时也可以使用该Combine方法):
如下图:
chart创建方法的重载版本,运行数据通过不同的方法来指定。基本上,大部分的chart都允许通过以下机制来指定chart的数据源:
只含有y轴数据的队列(sequence)(x轴的数据,隐式的从1开始被自动指定,就如同上面chart的创建方式一样)
x轴和y轴的两个独立队列(sequence)
(x,y)向量队列
y轴或者(x,y)的System.IObservable类型,允许在添加数据时及时更新chart
此外,并没有限定x或者y轴的数据必须是浮点数,这些数据只需要是实现了System.IConvertible.IConvertible 接口的类型即可。这就意味着,很容易创建数据被分类命名的chart图表:
当然也就很容易的,用时间或者日期创建plot 图表:
二,新版本新增功能
1,复制到剪切板和另存功能
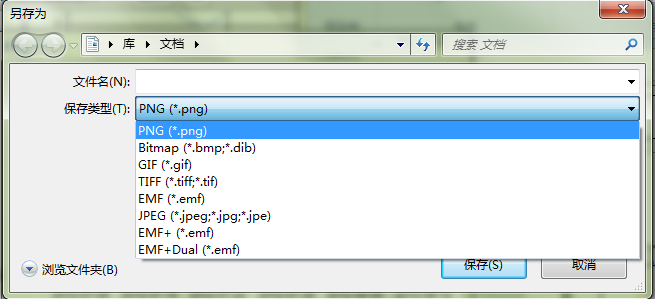
最新版本中,以及扩展了复制图片到剪切板和将chart另存为图片的功能,复制图片到剪切板以及支持EMF(Enhanced(Extended)Windows Metafile Format)格式。
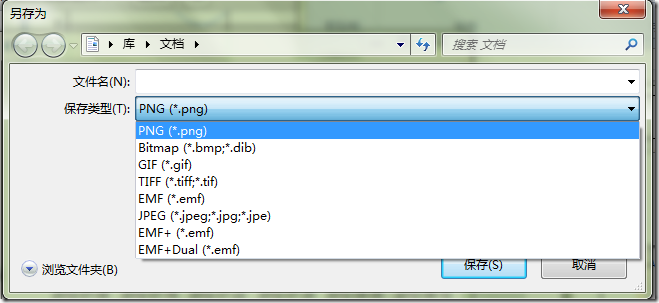
同时也支持保存为不同格式图片:
对于复制图片和另存为功能,也添加代码编程的支持。将chart复制到剪切板,仅仅只需要调用CopyToClipBoard方法:
同样的,调用Save和CopyToClipboard相似。
2,Property Changed Event
新版本中一种改进是当某些GenericChart属性发生改变时支持Event事件,包括:Name,Title,Margin,Legend和所有的常用属性。这些事件也在代码内部使用,用来传递GenericChart的改变到绑定的chart。
这种功能支持以下代码:
3,3D chart
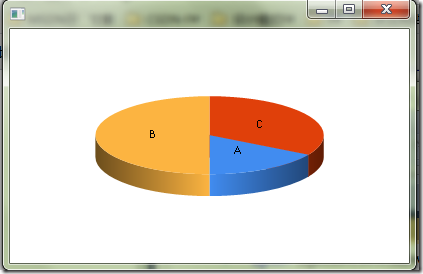
正如你所知道的,Windows Forms charting支持3D渲染,现在也包括了用于GenericChart 3D属性的支持。作为一个例子,PieChart饼状图启用3D效果:
这种功能支持全部的特性,包括:Inclination,IsClustered,IsRightAngleAxes,LightStyle,Perspective,PointDepth,PointGapDepth,Rotation,WallWidth。使用3Dchart 只需要设置
"Enable3D = true"即可。
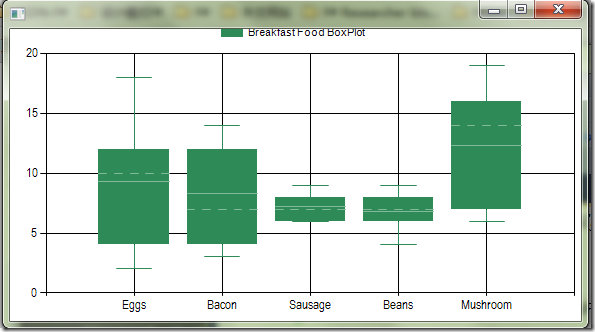
4,BoxPlot Data Series
如您所熟悉的,BoxPlot图表是显示几个系列数据的好方法,然而以前那个实现,在呈现几个系列数据时,总是默认的标记每个轴为1,2,3等,而这个新版本如所期望的一样,支持为每个数据系列自定义标签。因此现在可以用下面的代码,新建一个BoxPlot图表:
,
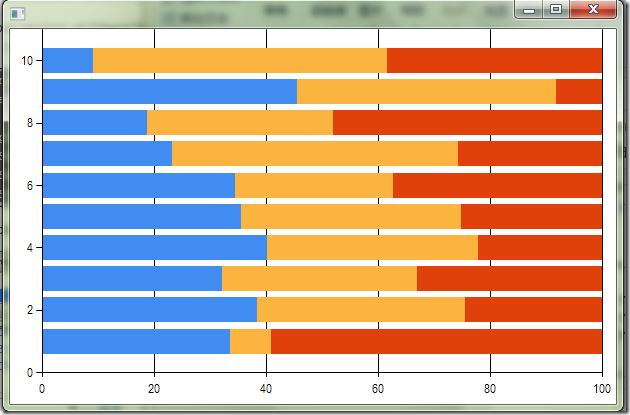
5, Stacked Chart
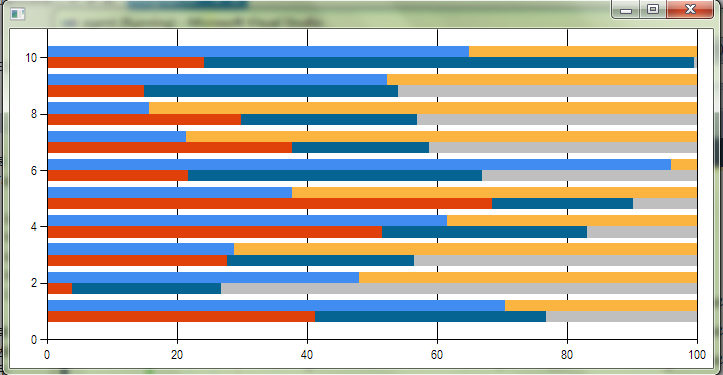
在之前FSharpChart版本中,绘制一个堆叠的图表(Stacked Chart)不是很直观。一个不得不做的事情是定义一个CombinedChart,同时将定义多个chart与相同的StackedGroupName属性值相结合:
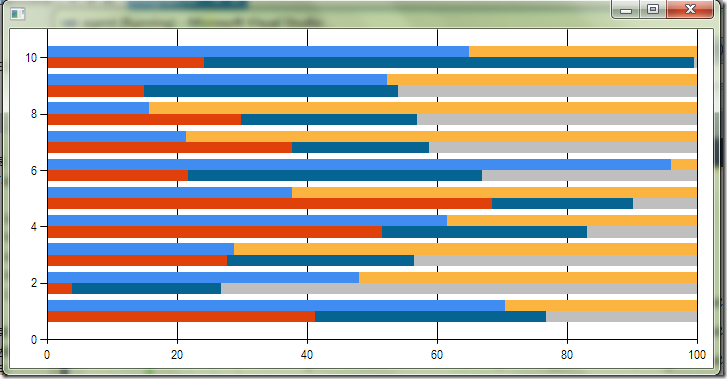
这种方法还允许通过使用不同StackedGroupName属性值,很轻松联合多个Stacked Chart:
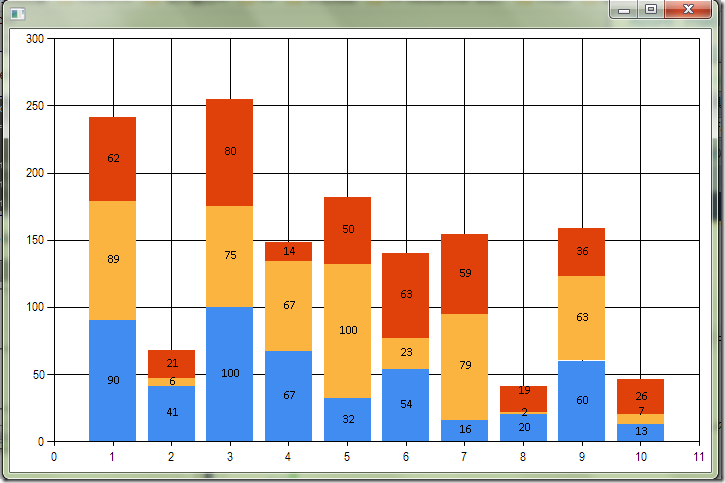
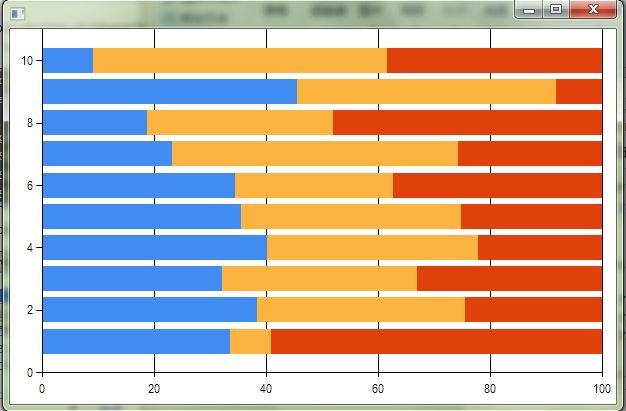
当然,对于Stacked Charts,一个更加直观的方法是仅仅指定一个数据列的列表。在这个新的版本中,现在可以使用如下格式:
list<list<'TY>>
list<list<'TX * 'TY>>
现在允许这样的一个定义,如下一个StackedColumn图表,使用一个简单得多表达式:
6,在数据列中添加标记
如下面代码所示,可以数据列中添加标记点
控制横纵坐标的显示与否,可以使用FSharpChart.WithArea.AxisY或者FSharpChart.WithArea.AxisX函数来处理,设这标题使用FSharpChart.WithTitle函数。如下:
最后一个提供一个更完整点的代码段(当然得如本文开头介绍的添加相应的DLL引用)如下:
总结:感谢Carl Nolan's的辛勤劳动,更多的相关信息还请参考Carl Nolans的博客。
同本文有关的更多示例代码下载:Demo.rar
最新版本的提供了,以下新的功能:
剪切板的另存为功能
属性改变事件
支持3D图表
BoxPlot图表的数据命名
在这之前需要新建一个F#的应用程序项目,添加对以下DLL的引用:
System.Windows.Forms.dll
System.Drawing.dll
System.Windows.Forms.DataVisualization.dll
WindowsFormsIntegration.dll
由于我想使用WPF(Windows Presentation Foundation)来承载Chart,所以需要对以下DLL的引用(我的另一篇文章有比较详细的过程描述):
System.Core.dll
System.Xaml.dl
PresentationCore.dll
PresentationFramework.dll
FSharpChart本质上是属于WinForm的控件,所以在WPF中要用WindowsFormsHost来承载。
一 , 基本功能
FSharpChart支持System.Windows.Forms.DataVisualization.Charting命名控件你的所有类型。通过使用FSharpChart类型的静态方法创建所有的chart类型,并且可以再智能感知浏览,如下图所示:
这些方法在chart上显示数据变得更加容易。
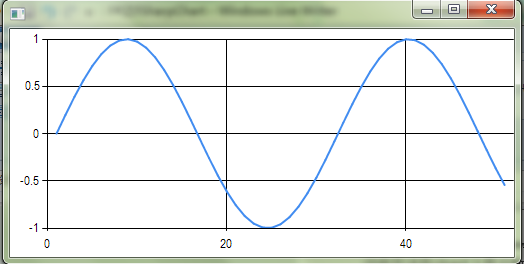
如:
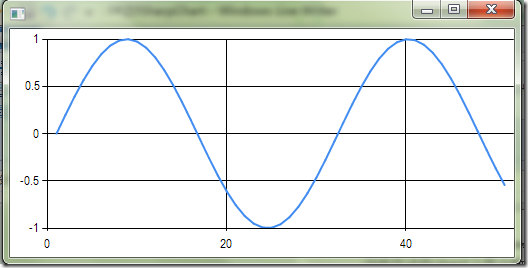
let line =
let line  = [for x in 0.0 .. 0.2 .. 10.0 –> sin x ]|> FSharpChart.Line
new ChartControl(line)
将以下图形包装为ChartControl控件:
每一个chart控件都有一个context menu菜单,可以轻松将chart复制到剪切板,保存为文件,查看(或者修改)详细的chart属性。
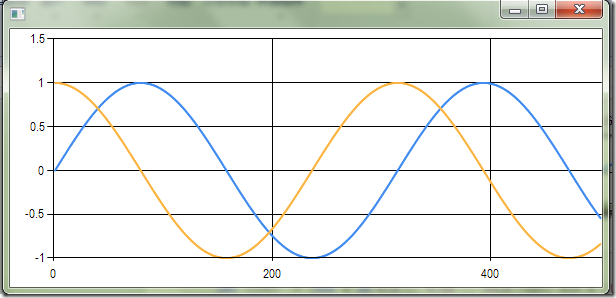
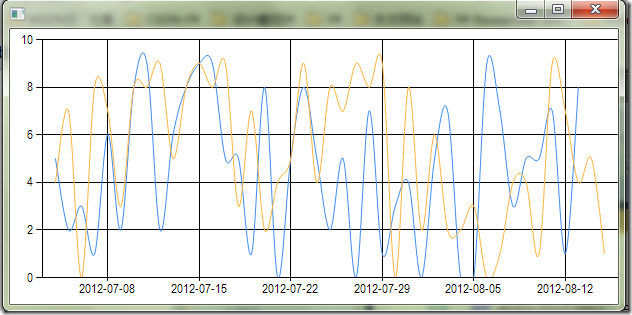
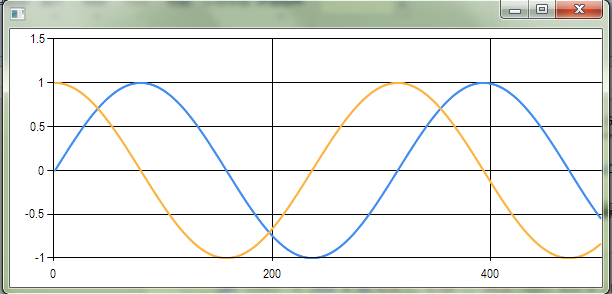
在一个Chart画两条曲线(组合其他图形的时也可以使用该Combine方法):
let lines =
let line1  = [for x in 0.0 .. 0.02 .. 10.0 -> sin x ]|> FSharpChart.Line
let line2  = [for x in 0.0 .. 0.02 .. 10.0 -> cos x ]|> FSharpChart.Line
new ChartControl( FSharpChart.Combine [line1;line2] )
如下图:
chart创建方法的重载版本,运行数据通过不同的方法来指定。基本上,大部分的chart都允许通过以下机制来指定chart的数据源:
只含有y轴数据的队列(sequence)(x轴的数据,隐式的从1开始被自动指定,就如同上面chart的创建方式一样)
x轴和y轴的两个独立队列(sequence)
(x,y)向量队列
y轴或者(x,y)的System.IObservable类型,允许在添加数据时及时更新chart
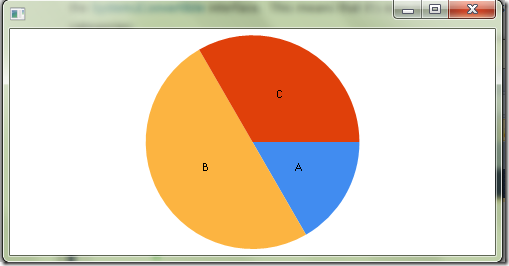
此外,并没有限定x或者y轴的数据必须是浮点数,这些数据只需要是实现了System.IConvertible.IConvertible 接口的类型即可。这就意味着,很容易创建数据被分类命名的chart图表:
let pie =
let c = [(“A”,1); (“B”,3); (“C”,2)]
|> FSharpChart.Pie
new ChartControl(c,Dock=DockStyle.Fill)
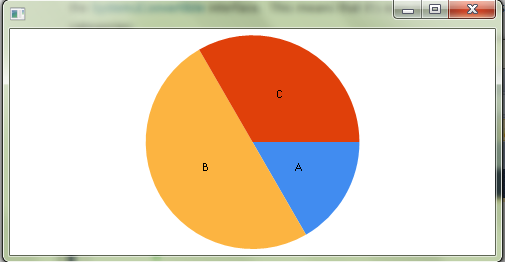
当然也就很容易的,用时间或者日期创建plot 图表:
let column  =
let r = Random()
let c m=
[for d in -30 .. m –>;
(DateTime.Today.AddDays(float  d) , r.Next(0 , 10))] |> FSharpChart.Spline
let c = FSharpChart.Combine [c 10; c 12]
new ChartControl(c)
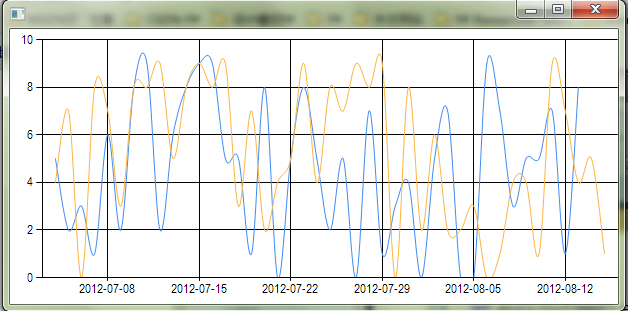
二,新版本新增功能
1,复制到剪切板和另存功能
最新版本中,以及扩展了复制图片到剪切板和将chart另存为图片的功能,复制图片到剪切板以及支持EMF(Enhanced(Extended)Windows Metafile Format)格式。
同时也支持保存为不同格式图片:
对于复制图片和另存为功能,也添加代码编程的支持。将chart复制到剪切板,仅仅只需要调用CopyToClipBoard方法:
[ for f in 1.0 .. 0.1 .. 10.0 -> sin (f * 2.0) + cos f ]
|> FSharpChart.Line
|> FSharpChart.WithCreate
|> FSharpChart.CopyToClipboard
同样的,调用Save和CopyToClipboard相似。
2,Property Changed Event
新版本中一种改进是当某些GenericChart属性发生改变时支持Event事件,包括:Name,Title,Margin,Legend和所有的常用属性。这些事件也在代码内部使用,用来传递GenericChart的改变到绑定的chart。
这种功能支持以下代码:
chart.Margin <- (2.0f, 12.0f, 2.0f, 2.0f)
chart.Title <- Helper.CreateTitle(“Chart Sin/Cosine”, Font = new Font(“Arial”, 12.0f, FontStyle.Bold))
chart.Legend <- Helper.CreateLegend(InsideArea = false, Font = new Font(“Arial”, 8.0f),
Alignment = StringAlignment.Center, Docking = Docking.Top)
3,3D chart
正如你所知道的,Windows Forms charting支持3D渲染,现在也包括了用于GenericChart 3D属性的支持。作为一个例子,PieChart饼状图启用3D效果:
let chart =
let c = [(“A”,1); (“B”,3); (“C”,2)]
|> FSharpChart.Pie
|> FSharpChart.WithArea.Area3DStyle(Enable3D=true,Inclination=70)
new ChartControl(c,Dock=DockStyle.Fill)
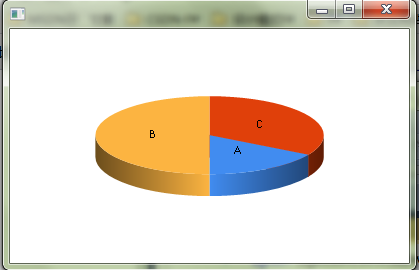
这种功能支持全部的特性,包括:Inclination,IsClustered,IsRightAngleAxes,LightStyle,Perspective,PointDepth,PointGapDepth,Rotation,WallWidth。使用3Dchart 只需要设置
"Enable3D = true"即可。
4,BoxPlot Data Series
如您所熟悉的,BoxPlot图表是显示几个系列数据的好方法,然而以前那个实现,在呈现几个系列数据时,总是默认的标记每个轴为1,2,3等,而这个新版本如所期望的一样,支持为每个数据系列自定义标签。因此现在可以用下面的代码,新建一个BoxPlot图表:
let boxplot =
let plot =
FSharpChart.BoxPlot
( [ "Eggs", [| for i in 0 .. 20 -> float (rnd.Next 20) |]
"Bacon", [| for i in 0 .. 20 -> float (rnd.Next 15 + 2) |]
"Sausage";, [| for i in 0 .. 20 -> float (rnd.Next 5 + 5) |]
"Beans";, [| for i in 0 .. 20 –> float (rnd.Next 10 + 3) |]
"Mushroom";, [| for i in 0 .. 20 –> float (rnd.Next 15 + 5) |] ],
Name = "Breakfast Food BoxPlot")
|> FSharpChart.WithMargin(1.0f, 5.0f, 1.0f, 1.0f)
|> FSharpChart.WithSeries.Style(Color = Color.SeaGreen)
|> FSharpChart.WithLegend(InsideArea = false, Font = new Font(“Arial”, 8.0f),
Alignment = StringAlignment.Center, Docking = Docking.Top)
new  ChartControl (plot)
,
5, Stacked Chart
在之前FSharpChart版本中,绘制一个堆叠的图表(Stacked Chart)不是很直观。一个不得不做的事情是定义一个CombinedChart,同时将定义多个chart与相同的StackedGroupName属性值相结合:
let rnd = new System.Random ()
let datax() = [ for  f in 1 .. 10 –> rnd.NextDouble( ) * 10.0]
let starckbar =
let bar =
FSharpChart.Combine
[
FSharpChart.StackedBar100(datax(),StackedGroupName=”g1”)
FSharpChart.StackedBar100(datax(),StackedGroupName=”g1”)
FSharpChart.StackedBar100(datax(),StackedGroupName=”g1”)
]
new ChartControl(bar)
这种方法还允许通过使用不同StackedGroupName属性值,很轻松联合多个Stacked Chart:
FSharpChart.Combine
[ FSharpChart.StackedBar(dataX(), StackedGroupName = “g1”)
FSharpChart.StackedBar(dataX(), StackedGroupName = “g1”)
FSharpChart.StackedBar(dataX(), StackedGroupName = “g1”)
FSharpChart.StackedBar(dataX(), StackedGroupName = “g2”)
FSharpChart.StackedBar(dataX(), StackedGroupName = “g2”) ]
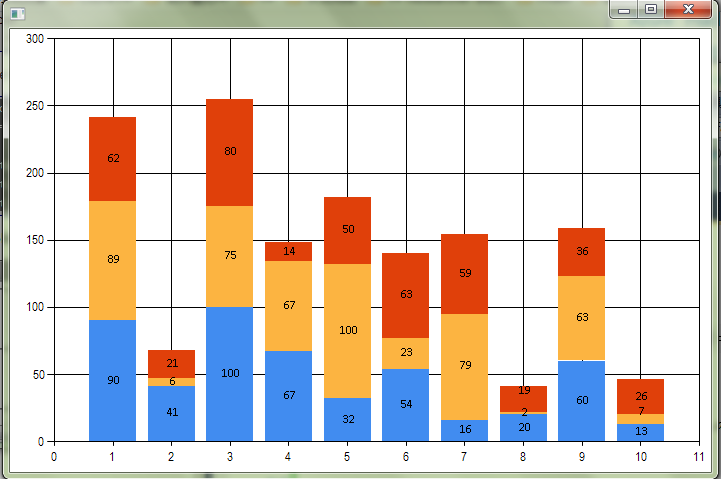
当然,对于Stacked Charts,一个更加直观的方法是仅仅指定一个数据列的列表。在这个新的版本中,现在可以使用如下格式:
list<list<'TY>>
list<list<'TX * 'TY>>
现在允许这样的一个定义,如下一个StackedColumn图表,使用一个简单得多表达式:
let rndStacked = new System.Random()
let dataXY() = [ for f in 1 .. 10 –> (f, round (rndStacked.NextDouble() * 100.0))]

[dataXY(); dataXY(); dataXY()]
|> FSharpChart.StackedColumn
|> FSharpChart.WithSeries.DataPoint(Label=”#VAL”)
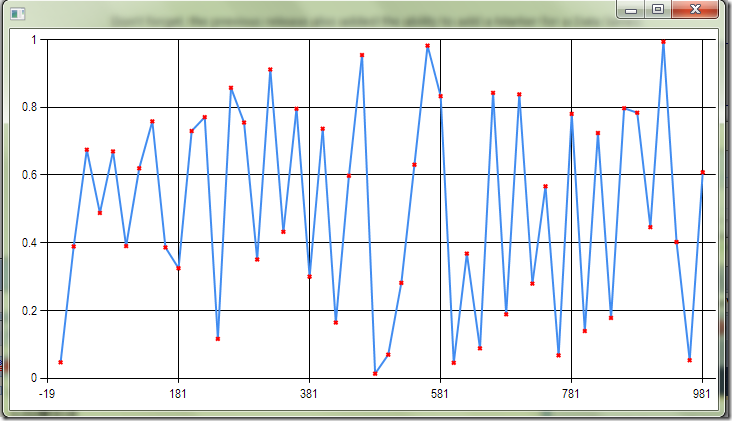
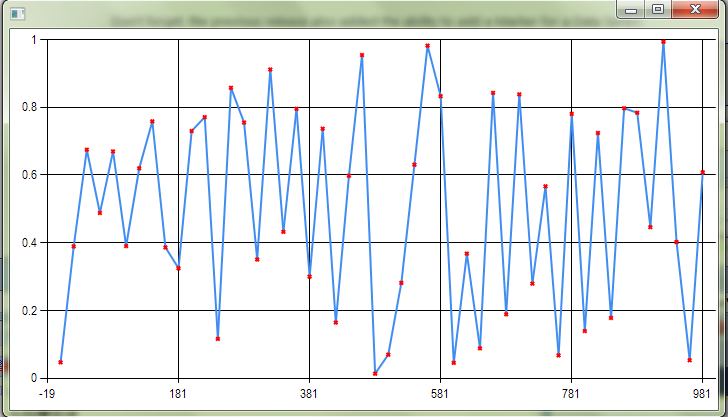
6,在数据列中添加标记
如下面代码所示,可以数据列中添加标记点
let markLine =
let rnd = new System.Random()
let line =
[for i in 1..20..1000 -> i , rnd.NextDouble()]
|> FSharpChart.Line
|> FSharpChart.WithSeries.Marker(Color = Color.Red ,Style=MarkerStyle.Circle)
new ChartControl(line)
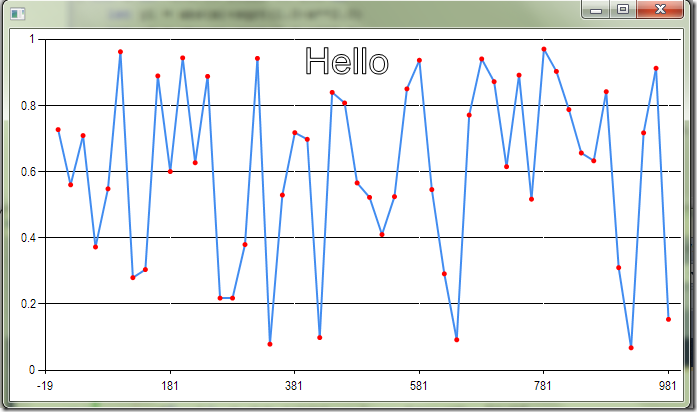
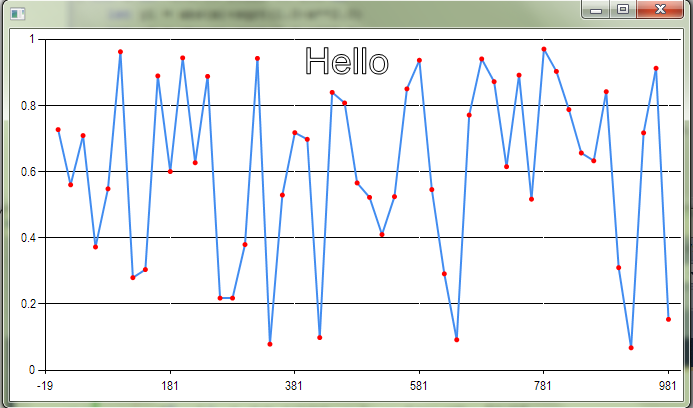
控制横纵坐标的显示与否,可以使用FSharpChart.WithArea.AxisY或者FSharpChart.WithArea.AxisX函数来处理,设这标题使用FSharpChart.WithTitle函数。如下:
let markLine =
let rnd = new System.Random()
let line =
[for i in 1..20..1000 –> i , rnd.NextDouble()]
|> FSharpChart.Line
|> FSharpChart.WithTitle(“Hello”,TextStyle=TextStyle.Frame,Font = new Font(“Arial”, 28.0f))
|> FSharpChart.WithSeries.Marker(Color = Color.Red ,Style=MarkerStyle.Circle)
|>FSharpChart.WithArea.AxisX(MajorGrid = Grid(LineColor = Color.White))
new ChartControl(line)
最后一个提供一个更完整点的代码段(当然得如本文开头介绍的添加相应的DLL引用)如下:
open System
open System.Windows
open System.Windows.Controls
open System.Windows.Forms.Integration
open System.Windows.Forms.DataVisualization.Charting
open System.Windows.Forms
open MSDN.FSharp.Charting
open System.Drawing // for Color

let markLine =
let rnd = new System.Random()
let line =
[for i in 1..20..1000 -> i , rnd.NextDouble()]
|> FSharpChart.Line
|> FSharpChart.WithTitle("Hello",TextStyle=TextStyle.Frame,Font = new Font("Arial", 28.0f))
|> FSharpChart.WithSeries.Marker(Color = Color.Red ,Style=MarkerStyle.Circle)
|>FSharpChart.WithArea.AxisX(MajorGrid = Grid(LineColor = Color.White))
new ChartControl(line)

let mainNoXaml() =
let formsHost =new  WindowsFormsHost(Child = markLine)//(Child=starckbar)
let window = Window()
window.Content <- formsHost
let app =new System.Windows.Application() in app.Run(window) |> ignore

[<STAThread>]
do mainNoXaml()总结:感谢Carl Nolan's的辛勤劳动,更多的相关信息还请参考Carl Nolans的博客。
同本文有关的更多示例代码下载:Demo.rar

相关文章推荐
- FSharpChart 图表应用
- FSharpChart 图表应用
- FusionChart图表控件使用说明
- Windows Phone 7 chart图表编程
- AchartEngine 统计图表开发总结
- Extjs学习 图表Chart概述
- chart.js绘制移动端图表
- java/word+fusionchart生成图表
- flash图表选型分析:FusionCharts or Open Flash Chart ?
- Nevron Chart 教程(1):详解Nevron Chart .NET图表的Axis scale breaks特性
- Open Flash Chart 图表组件
- 开源和收费图表工具对比:JFreeChart vs ChartDirector
- NPOI根据模板生成chart图表导出Excel
- jQuery 图表插件 jqChart 使用绘制雷达图
- 自动化邮件报告平台-邮件发送highchart图表
- Asp.net 2.0 自定义控件开发[开发一个图表(WebChart)控件(柱状图示例)](示例代码下载)
- Asp.net 2.0 自定义控件开发[开发一个图表(WebChart)控件(柱状图示例)](示例代码下载)
- Chart图表
- 利用Google Chart API直接制图表
- Android学习之 AChartEngine 图表绘制