Highcharts结合Asp.net实现动态数据股票式图形显示实例 .【转】
2012-06-25 14:51
881 查看
本实例针对的具体应用行情是我需要定时从数据库中读取某商品价格,然后以图形显示在网页上,类似于股票中的交易品种价格走势图.
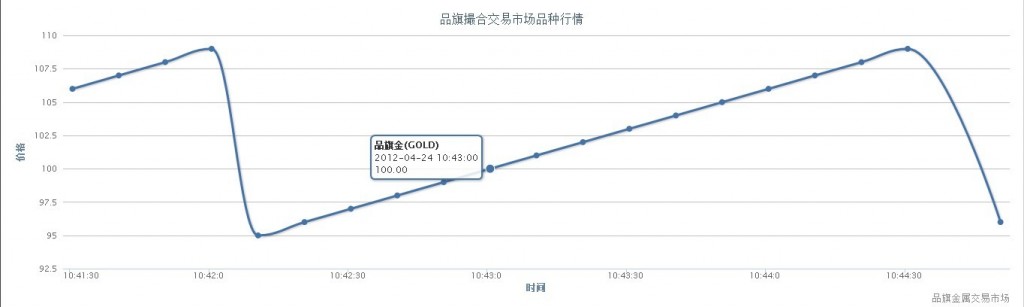
我使用的是asp.net,结合jQuery中的Highcharts插件实现,该插件可以支持很多类型的图形,但都是静态的,提供的实例都需要改造,有兴趣的朋友可以去Highcharts官网看看(http://www.highcharts.com/),里面提供了很多的Demo,说实在的要实现我的需求,更应该使用Highstock,但是看了Highcharts的dynamic-update实例,也可以实现我的需求界面更加简洁些,所以本文采用的是Highcharts中dynamic-update模型,图形类型是spline最终实现的效果贴图如下(品旗金这个品种的价格是10秒种更新一次的,每10秒对线状图形加一个点):
实现步聚:
用vs新建一web网站,新建asp.net页面DynamicUpdate.aspx,页面代码如下:
[html] view plaincopyprint?
<%@ Page Language="C#" AutoEventWireup="true" CodeBehind="DynamicUpdate.aspx.cs"
Inherits="WebImg.DynamicUpdate" %>
<!DOCTYPE HTML>
<html>
<head>
<meta http-equiv="Content-Type" content="text/html; charset=utf-8">
<title>动态显示价格图例</title>
<script type="text/javascript" src="http://ajax.googleapis.com/ajax/libs/jquery/1.7.1/jquery.min.js"></script>
<script type="text/javascript">
$(function () {
$(document).ready(function () {
Highcharts.setOptions({
global: {
useUTC: false
}
});
var chart;
chart = new Highcharts.Chart({
chart: {
renderTo: 'container',
type: 'spline',
marginRight: 10,
events: {
load: function () {
// set up the updating of the chart each second
var series = this.series[0];
setInterval(function () {
var randomCode = parseInt(Math.random() * 10000);
var oldrandomCode = parseInt(Math.random() * 10000);
$.ajax({
url: "ajaxhandler/dataupdate.ashx?" + randomCode + "=" + oldrandomCode + "&flag=1",
type: "get",
dataType: "json",
success: function (data, textStatus, XMLHttpRequest) {
var ctime = new Date();
ctime.setTime(parseInt(data.rows[0].times));
var x = ctime.getTime(), // current time
y = data.rows[0].price * 200;
series.addPoint([x, y], true, true);
},
error: function () { }
});
}, 10000);
}
}
},
title: {
text: '品旗撮合交易市场品种行情'
},
xAxis: {
title: {
text: '时间'
},
type: 'datetime',
tickPixelInterval: 150,
labels:{formatter:function(){
var vDate = new Date(this.value);
return vDate.getHours()+":"+vDate.getMinutes()+":"+vDate.getSeconds();
}}
},
yAxis: {
title: {
text: '价格'
},
plotLines: [{
value: 0,
width: 1,
color: '#808080'
}]
},
tooltip: {
formatter: function () {
return '<b>' + this.series.name + '</b><br/>' +
Highcharts.dateFormat('%Y-%m-%d %H:%M:%S', this.x) + '<br/>' +
Highcharts.numberFormat(this.y, 2);
}
},
legend: {
enabled: false
},
exporting: {
enabled: false
},
credits:{
text:'品旗金属交易市场',
url:'http://www.inv6.com'
},
series: [{
name: '品旗金(GOLD)',
data: (function () {
var data = [],
i;
var jsonData = <%= jsonstr %>;
for (i = -19; i <= 0; i++) {
var ctime = new Date();
ctime.setTime(parseInt(jsonData.rows[i+19].time1));
data.push({
x: ctime.getTime(),
y: jsonData.rows[i + 19].price * 200
});
}
return data;
})()
}]
});
});
});
</script>
</head>
<body>
<script src="http://code.highcharts.com/highcharts.js"></script>
<script src="http://code.highcharts.com/modules/exporting.js"></script>
<div id="container" style="min-width: 400px; height: 400px; margin: 0 auto">
</div>
</body>
</html>
其中TabMerPrice表是品种价格信息表,TMPTime时间,TMPPrice价格,TMPTime的时间间隔是十秒,我用数据库作业生成该表的记录,十秒钟发生一次
AddHours(-8)是为了将时间转换为北京时间,生成的数据格式是json格式
dataupdate.ashx代码如下:
[csharp] view plaincopyprint?
public void ProcessRequest(HttpContext context)
{
string flag = context.Request.QueryString["flag"].ToString();
switch (flag)
{
case "1"://获取品种当前价格
GetMerPrice(context);
break;
}
}
private void GetMerPrice(HttpContext context)
{
context.Response.Clear();
context.Response.Buffer = true;
context.Response.ContentType = "application/json";
context.Response.ContentEncoding.GetBytes("utf-8");
DataTable dtPrice = SQLDBHelper.ExecuteTable("select top 1 TMPCode,TMPTime,TMPPrice from TabMerPrice with(nolock) order by TMPTime desc");
string json = "{\"rows\":[";
json += "{\"times\":\"" + (Convert.ToDateTime(dtPrice.Rows[0]["TMPTime"]).AddHours(-8) - new DateTime(1970, 1, 1)).TotalMilliseconds + "\",\"price\":\"" + (Convert.ToDecimal(dtPrice.Rows[0]["TMPPrice"]) / 200) + "\"}";
json = json.TrimEnd(',');
json += "]}";
context.Response.Write(json);
context.Response.Flush();
context.Response.End();
}
我使用的是asp.net,结合jQuery中的Highcharts插件实现,该插件可以支持很多类型的图形,但都是静态的,提供的实例都需要改造,有兴趣的朋友可以去Highcharts官网看看(http://www.highcharts.com/),里面提供了很多的Demo,说实在的要实现我的需求,更应该使用Highstock,但是看了Highcharts的dynamic-update实例,也可以实现我的需求界面更加简洁些,所以本文采用的是Highcharts中dynamic-update模型,图形类型是spline最终实现的效果贴图如下(品旗金这个品种的价格是10秒种更新一次的,每10秒对线状图形加一个点):
实现步聚:
用vs新建一web网站,新建asp.net页面DynamicUpdate.aspx,页面代码如下:
[html] view plaincopyprint?
<%@ Page Language="C#" AutoEventWireup="true" CodeBehind="DynamicUpdate.aspx.cs"
Inherits="WebImg.DynamicUpdate" %>
<!DOCTYPE HTML>
<html>
<head>
<meta http-equiv="Content-Type" content="text/html; charset=utf-8">
<title>动态显示价格图例</title>
<script type="text/javascript" src="http://ajax.googleapis.com/ajax/libs/jquery/1.7.1/jquery.min.js"></script>
<script type="text/javascript">
$(function () {
$(document).ready(function () {
Highcharts.setOptions({
global: {
useUTC: false
}
});
var chart;
chart = new Highcharts.Chart({
chart: {
renderTo: 'container',
type: 'spline',
marginRight: 10,
events: {
load: function () {
// set up the updating of the chart each second
var series = this.series[0];
setInterval(function () {
var randomCode = parseInt(Math.random() * 10000);
var oldrandomCode = parseInt(Math.random() * 10000);
$.ajax({
url: "ajaxhandler/dataupdate.ashx?" + randomCode + "=" + oldrandomCode + "&flag=1",
type: "get",
dataType: "json",
success: function (data, textStatus, XMLHttpRequest) {
var ctime = new Date();
ctime.setTime(parseInt(data.rows[0].times));
var x = ctime.getTime(), // current time
y = data.rows[0].price * 200;
series.addPoint([x, y], true, true);
},
error: function () { }
});
}, 10000);
}
}
},
title: {
text: '品旗撮合交易市场品种行情'
},
xAxis: {
title: {
text: '时间'
},
type: 'datetime',
tickPixelInterval: 150,
labels:{formatter:function(){
var vDate = new Date(this.value);
return vDate.getHours()+":"+vDate.getMinutes()+":"+vDate.getSeconds();
}}
},
yAxis: {
title: {
text: '价格'
},
plotLines: [{
value: 0,
width: 1,
color: '#808080'
}]
},
tooltip: {
formatter: function () {
return '<b>' + this.series.name + '</b><br/>' +
Highcharts.dateFormat('%Y-%m-%d %H:%M:%S', this.x) + '<br/>' +
Highcharts.numberFormat(this.y, 2);
}
},
legend: {
enabled: false
},
exporting: {
enabled: false
},
credits:{
text:'品旗金属交易市场',
url:'http://www.inv6.com'
},
series: [{
name: '品旗金(GOLD)',
data: (function () {
var data = [],
i;
var jsonData = <%= jsonstr %>;
for (i = -19; i <= 0; i++) {
var ctime = new Date();
ctime.setTime(parseInt(jsonData.rows[i+19].time1));
data.push({
x: ctime.getTime(),
y: jsonData.rows[i + 19].price * 200
});
}
return data;
})()
}]
});
});
});
</script>
</head>
<body>
<script src="http://code.highcharts.com/highcharts.js"></script>
<script src="http://code.highcharts.com/modules/exporting.js"></script>
<div id="container" style="min-width: 400px; height: 400px; margin: 0 auto">
</div>
</body>
</html>
[csharp] view plaincopyprint?

public string jsonstr = "";

protected void Page_Load(object sender, EventArgs e)

{

getData();

}

private void getData()

{

DataTable dtPrice = SQLDBHelper.ExecuteTable("select top 20 TMPCode,TMPTime,TMPPrice from TabMerPrice with(nolock) order by TMPTime desc");

string json = "{\"rows\":[";

for (int i = (dtPrice.Rows.Count-1); i >= 0; i--)

{

json += "{\"time1\":\"" + (Convert.ToDateTime(dtPrice.Rows[i]["TMPTime"]).AddHours(-8) - new DateTime(1970, 1, 1)).TotalMilliseconds + "\",\"price\":\"" + (Convert.ToDecimal(dtPrice.Rows[i]["TMPPrice"])/200) + "\"},";

}

json = json.TrimEnd(',');

json += "]}";

jsonstr = json;

}

public string jsonstr = "";
protected void Page_Load(object sender, EventArgs e)
{
getData();
}
private void getData()
{
DataTable dtPrice = SQLDBHelper.ExecuteTable("select top 20 TMPCode,TMPTime,TMPPrice from TabMerPrice with(nolock) order by TMPTime desc");
string json = "{\"rows\":[";
for (int i = (dtPrice.Rows.Count-1); i >= 0; i--)
{
json += "{\"time1\":\"" + (Convert.ToDateTime(dtPrice.Rows[i]["TMPTime"]).AddHours(-8) - new DateTime(1970, 1, 1)).TotalMilliseconds + "\",\"price\":\"" + (Convert.ToDecimal(dtPrice.Rows[i]["TMPPrice"])/200) + "\"},";
}
json = json.TrimEnd(',');
json += "]}";
jsonstr = json;
}
其中TabMerPrice表是品种价格信息表,TMPTime时间,TMPPrice价格,TMPTime的时间间隔是十秒,我用数据库作业生成该表的记录,十秒钟发生一次
AddHours(-8)是为了将时间转换为北京时间,生成的数据格式是json格式
dataupdate.ashx代码如下:
[csharp] view plaincopyprint?
public void ProcessRequest(HttpContext context)
{
string flag = context.Request.QueryString["flag"].ToString();
switch (flag)
{
case "1"://获取品种当前价格
GetMerPrice(context);
break;
}
}
private void GetMerPrice(HttpContext context)
{
context.Response.Clear();
context.Response.Buffer = true;
context.Response.ContentType = "application/json";
context.Response.ContentEncoding.GetBytes("utf-8");
DataTable dtPrice = SQLDBHelper.ExecuteTable("select top 1 TMPCode,TMPTime,TMPPrice from TabMerPrice with(nolock) order by TMPTime desc");
string json = "{\"rows\":[";
json += "{\"times\":\"" + (Convert.ToDateTime(dtPrice.Rows[0]["TMPTime"]).AddHours(-8) - new DateTime(1970, 1, 1)).TotalMilliseconds + "\",\"price\":\"" + (Convert.ToDecimal(dtPrice.Rows[0]["TMPPrice"]) / 200) + "\"}";
json = json.TrimEnd(',');
json += "]}";
context.Response.Write(json);
context.Response.Flush();
context.Response.End();
}

相关文章推荐
- Highcharts结合Asp.net实现动态数据股票式图形显示实例
- Highcharts结合Asp.net实现动态数据股票式图形显示实例
- ASP.NET中Visio图形的控制与数据的动态显示
- ASP.NET+JQuery+.Ashx实现+百度Echarts 实现动态柱状图数据图形报表的统计
- ASP.NET中Visio图形的控制与数据的动态显示
- asp.net下可实现超酷图表,超酷实时数据仪表显示
- ASP.NET GridView 实现课程表显示(动态合并单元格)实现步骤
- ASP.NET网站权限设计实现(三)——套用JQuery EasyUI列表显示数据、分页、查询
- HighCharts动态显示数据实例
- jquery结合highcharts插件显示实时数据动态曲线图
- asp.net实现动态显示当前日期时间——用asp自己封装的AJAX
- ASP.NET(四):ASP.net实现假分页显示数据
- [原创]asp.net结合html,javascript实现无刷新跨域数据提交
- asp.net实现上传文件显示本地绝对路径的实例代码
- ASP.NET中动态获取数据使用Highcharts图表控件【Copy By Internet】
- MVC3 数据分页 ASP.NET实现无刷新分页实例
- ASP.NET GridView 实现课程表显示(动态合并单元格)实现步骤
- ASP.NET(四):ASP.net实现假分页显示数据
- asp.net Mvc中实现在View页面中嵌入公用动态数据,实现方法为:include(包含动态页面数据)
- Highcharts、AJAX、JSON、JQuery实现动态数据交互显示图表柱形图