A step-by-step guide for debugging native code (Sequoyah/ndk guide)
2012-05-30 22:13
501 查看
原文地址::http://wiki.eclipse.org/Sequoyah/ndk_guide
http://download.eclipse.org/sequoyah/updates/1.1 or http://download.eclipse.org/sequoyah/updates/2.0.
It will install CDT's dependencies if needed:
The platform must be Android 2.2 (android-8) or greater
The ndk version must be r4b or newer
Eclipse CDT 7.0 or newer must be installed
The AndroidManifest.xml must have the property of the application node android:debuggable="true" or the project must have been built with the flag "NDK_DEBUG=1" (for r5):
The build must have been done with the ndk-build (if using the Sequoyah Android components, it will be automatic)
Open the ndk-gdb script that came with the android NDK and comment the last line
(we are not calling the usual gdb client, but we will attach an Eclipse gdb session instead):
Insert a breakpoint in your Java code, preferably after all System.loadLibrary() calls, in order to make sure that the debugger is correctly attached to the Java process.
Launch the android debug and wait for it to reach the breakpoint
From a Terminal session, in the project folder, run the modified ndk-gdb command. It should not attach to an gdb client, but call the gdbserver on the emulator and open a TCP port for connection.
Create a debug configuration for a C/C++ application
Set the following properties:
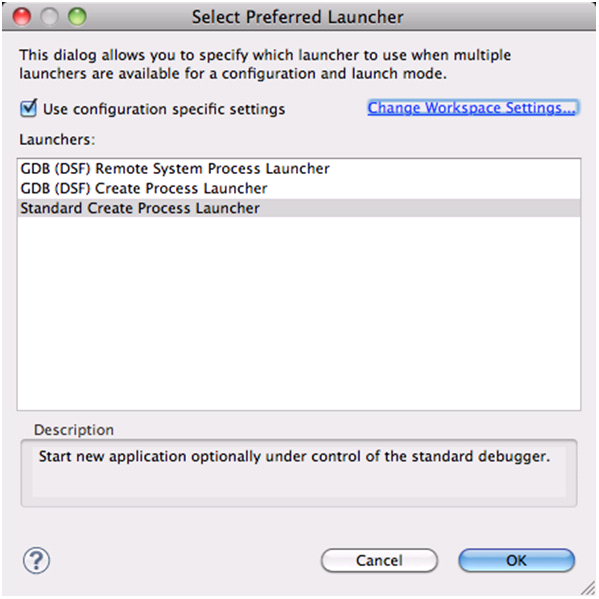
The process launcher must be the Standard Process Launcher. This is selected at the bottom of the Main tab:
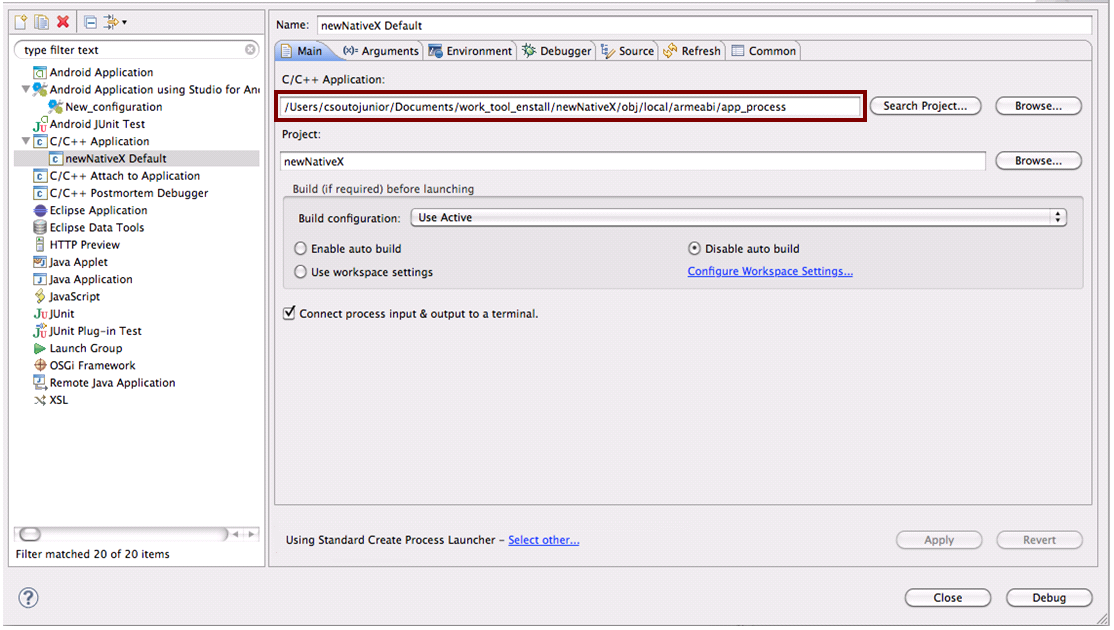
On the "Main" tab: the Field C/C++ Application:
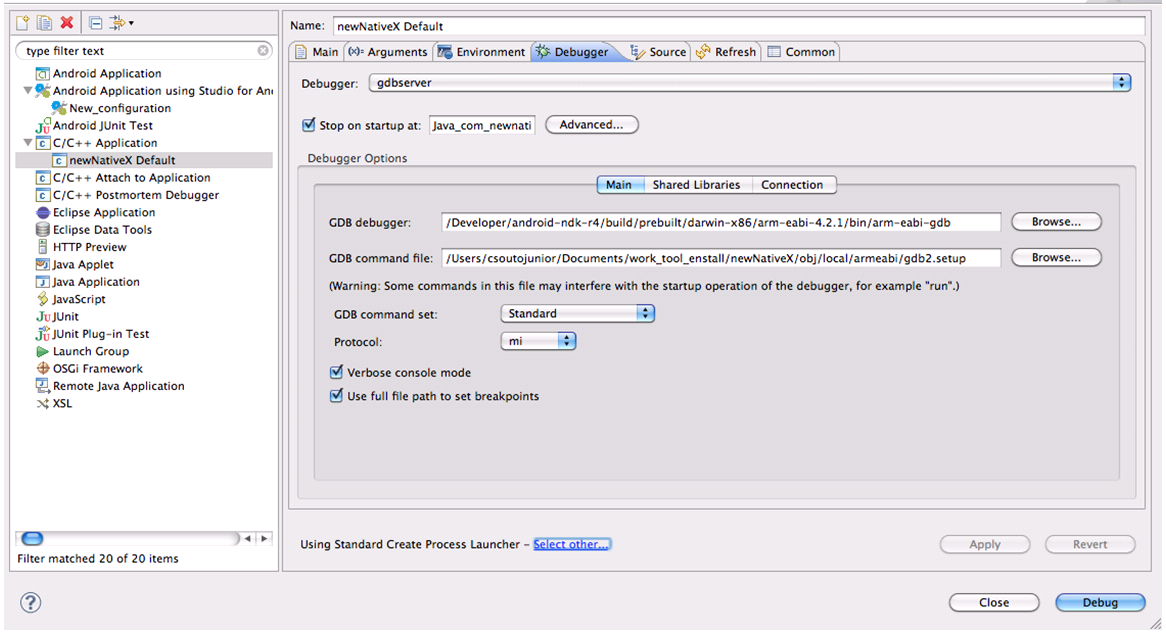
On the "Debugger" tab:
field Debugger: gdbserver
On the "Main" subtab:
GDB debugger:
GDB command file:
[Windows users] Uncheck the "Use full file path to set breakpoints" option
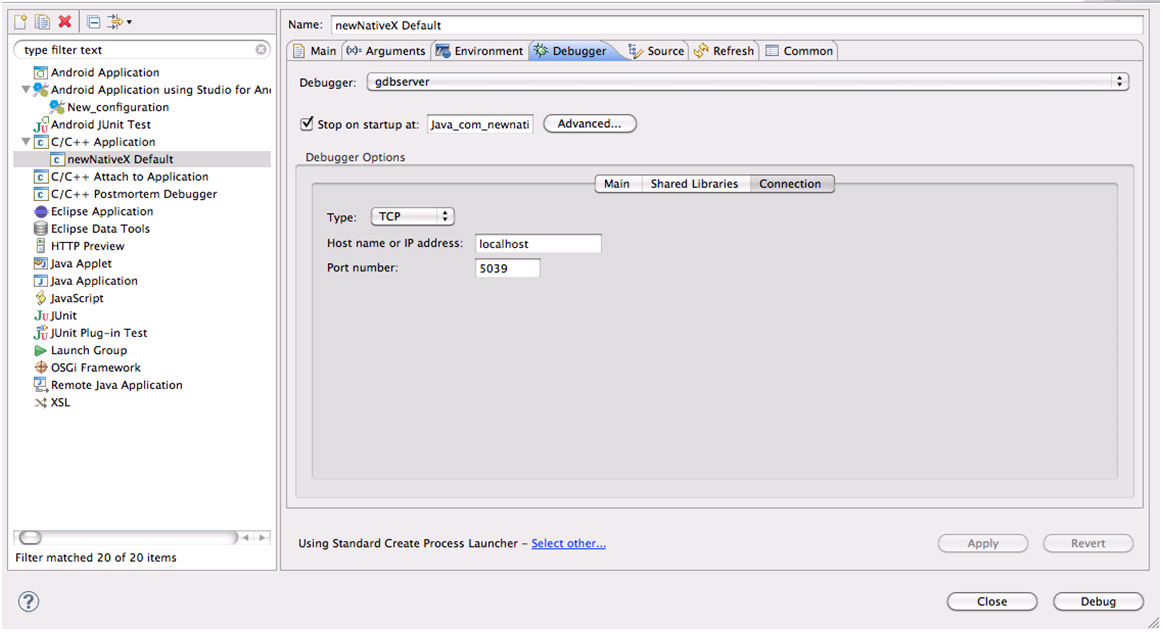
On the "Connection" subtab:
Type: TCP
Hostname or IP address: localhost
Port number: 5039
Modify the gdb.setup file located in the folder
removing the "target remote:5039" statement.
(For some reason, the Eclipse GDB session does not like this statement being done in the commands file) Rename this new file to gdb2.setup. This step needs to be run just once, on the first debug session. (I am working on further tweaking the ndk-gdb script
to generate the gdb.setup file without the target statement, but for the time being, this workaround will work).
Launch the C/C++ Application debug and wait for the Eclipse GDB session to fully connect to the emulator's gdbserver instance.
After following these steps, one can continue to debug the application as usual, using the "continue" option to let the execution flow until the next breakpoint is hit or by using the usual "step-in" to execute each statement individually. Setting a breakpoint
on a Java statement that calls a native function through JNI and stepping into will place the user at the beginning of the native code.
Retrieved from "http://wiki.eclipse.org/Sequoyah/ndk_guide"
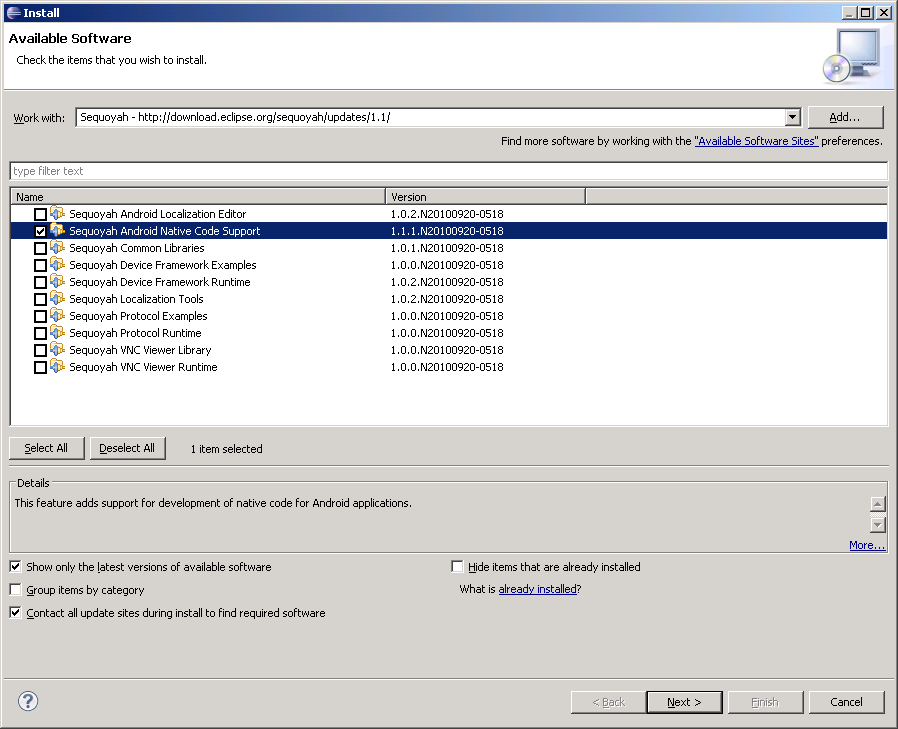
Pre-requisites
Sequoyah Native Debug feature must be installed. You can install it from Sequoyah update site either fromhttp://download.eclipse.org/sequoyah/updates/1.1 or http://download.eclipse.org/sequoyah/updates/2.0.

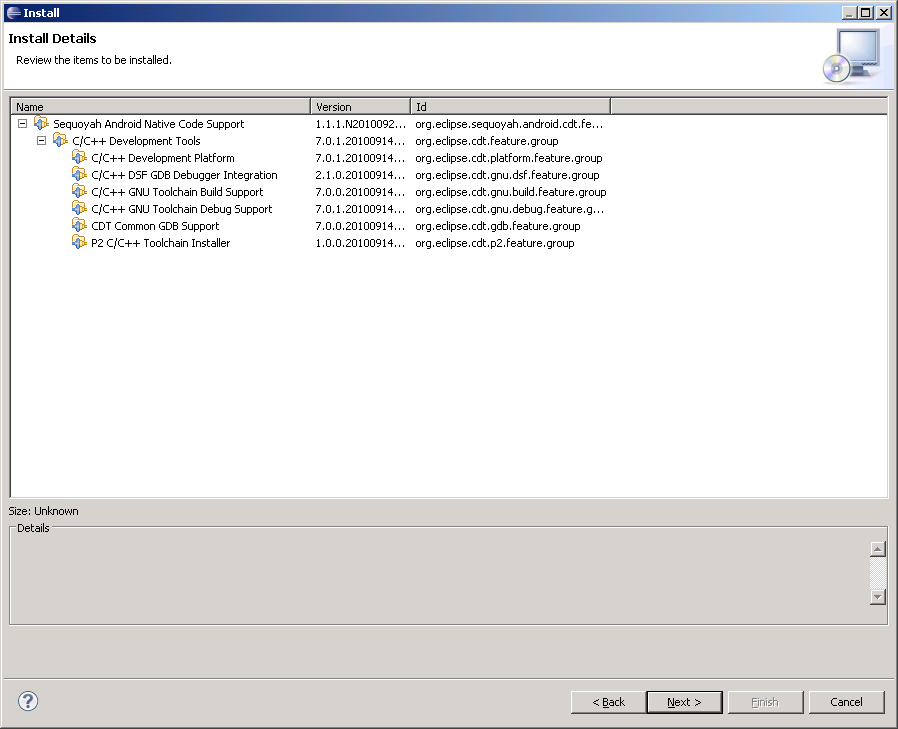
It will install CDT's dependencies if needed:
The platform must be Android 2.2 (android-8) or greater
The ndk version must be r4b or newer
Eclipse CDT 7.0 or newer must be installed
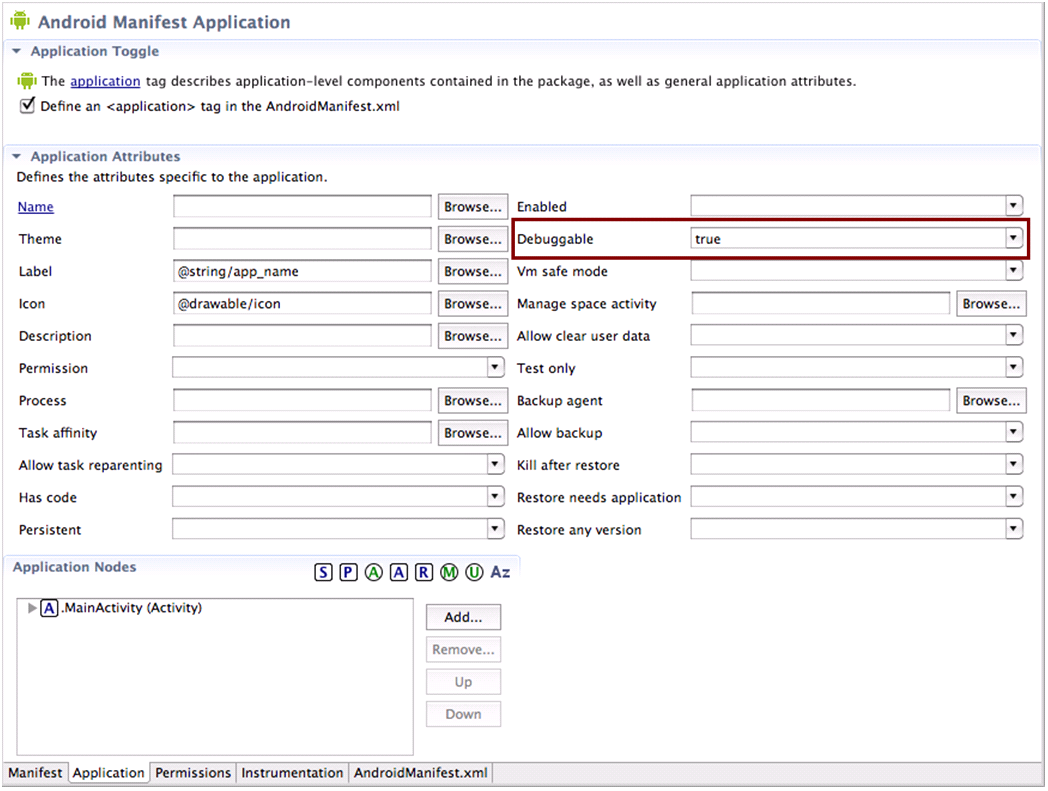
The AndroidManifest.xml must have the property of the application node android:debuggable="true" or the project must have been built with the flag "NDK_DEBUG=1" (for r5):
The build must have been done with the ndk-build (if using the Sequoyah Android components, it will be automatic)
Setting up the debug session
Create a debug configuration for an Android application (can be done with Eclipse or MOTODEV Studio)Open the ndk-gdb script that came with the android NDK and comment the last line
(we are not calling the usual gdb client, but we will attach an Eclipse gdb session instead):
#$GDBCLIENT -x $GDBSETUP -e $APP_PROCESS
Insert a breakpoint in your Java code, preferably after all System.loadLibrary() calls, in order to make sure that the debugger is correctly attached to the Java process.
Launch the android debug and wait for it to reach the breakpoint
From a Terminal session, in the project folder, run the modified ndk-gdb command. It should not attach to an gdb client, but call the gdbserver on the emulator and open a TCP port for connection.
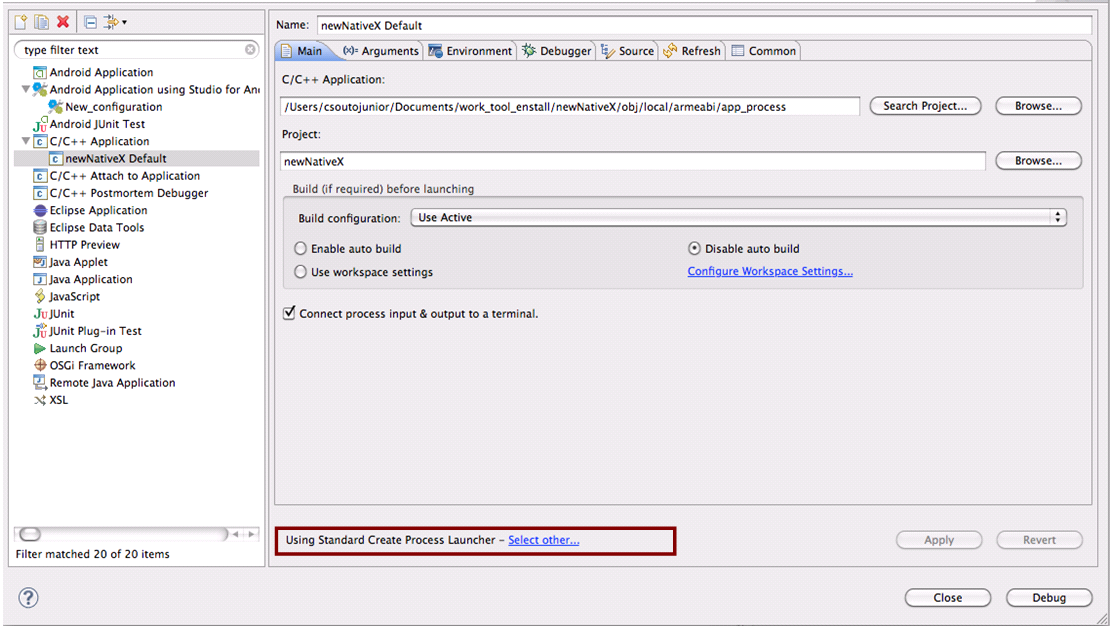
Create a debug configuration for a C/C++ application
Set the following properties:

The process launcher must be the Standard Process Launcher. This is selected at the bottom of the Main tab:


On the "Main" tab: the Field C/C++ Application:
$PROJECT_PATH/obj/local/armeabi/app_process

On the "Debugger" tab:
field Debugger: gdbserver
On the "Main" subtab:
GDB debugger:
(for NDK r4b)
$NDK_PATH/build/prebuilt/$ARCH/arm-eabi-$GCC_VERSION/bin/arm-eabi-gdb

(for NDK r5)
$NDK_PATH/toolchains/arm-eabi-$GCC_VERSION/prebuilt/$ARCH/bin/arm-eabi-gdb
GDB command file:
$PROJECT_PATH/obj/local/armeabi/gdb2.setup
[Windows users] Uncheck the "Use full file path to set breakpoints" option

On the "Connection" subtab:
Type: TCP
Hostname or IP address: localhost
Port number: 5039

Modify the gdb.setup file located in the folder
$PROJECT_PATH/obj/local/armeabi/
removing the "target remote:5039" statement.
(For some reason, the Eclipse GDB session does not like this statement being done in the commands file) Rename this new file to gdb2.setup. This step needs to be run just once, on the first debug session. (I am working on further tweaking the ndk-gdb script
to generate the gdb.setup file without the target statement, but for the time being, this workaround will work).
Launch the C/C++ Application debug and wait for the Eclipse GDB session to fully connect to the emulator's gdbserver instance.
After following these steps, one can continue to debug the application as usual, using the "continue" option to let the execution flow until the next breakpoint is hit or by using the usual "step-in" to execute each statement individually. Setting a breakpoint
on a Java statement that calls a native function through JNI and stepping into will place the user at the beginning of the native code.
Retrieved from "http://wiki.eclipse.org/Sequoyah/ndk_guide"

相关文章推荐
- step-by-step guide for debugging native code,
- A step-by-step guide for debugging native code, by Carlos Souto
- Debug Native c/c++ Application for Android(Step by Step)
- Step-by-Step Guide to Portal Development for Microsoft Dynamics CRM - 摘自网络
- THE DEAD-SIMPLE STEP-BY-STEP GUIDE FOR FRONT-END DEVELOPERS TO GETTING UP AND RUNNING WITH NODE.JS,
- Step By Step Guide to configure the “Replicating directory changes” for SharePoint 2010 and 2013
- Debug Native c/c++ Application for Android(Step by Step)
- A Step-by-Step guide to create a simple FPM application using Feeder Class for FORM GUIBB
- Step-by-step Install Guide for Ubuntu
- Step-by-step setup guide for two interconnected Asterisk boxes with chan_ss7
- Step-By-Step Guide To Create Physical Standby On Normal File System For ASM Primary using RMAN (文档 I
- Debug Native c/c++ Application for Android(Step by Step)
- Rapid Portlet Development with WebSphere Portlet Factory: Step-by-Step Guide for Building Your Own P
- Debug Native c/c++ Application for Android(Step by Step)
- Debug Native c/c++ Application for Android(Step by Step)
- Step-By-Step Guide To Create Physical Standby On Normal File System For ASM Primary using RMAN
- How to Read and Understand a Scientific Paper: A Step-by-Step Guide for Non-Scientists
- Hadoop之—— WARN util.NativeCodeLoader: Unable to load native-hadoop library for your platform...
- Debugging Native Code
- util.NativeCodeLoader: Unable to load native-hadoop library foryour platform... using builtin-java c