POJ 2163 Easy Trading(我的水题之路——数组阶段n m的平均值比较)
2012-02-10 15:08
441 查看
Easy Trading
Description
Frank is a professional stock trader for Advanced Commercial Markets Limited (ACM Ltd). He likes "easy trading" -- using a straightforward strategy to decide when to buy stock and when to sell it. Frank has a database of historical stock prices for each day.
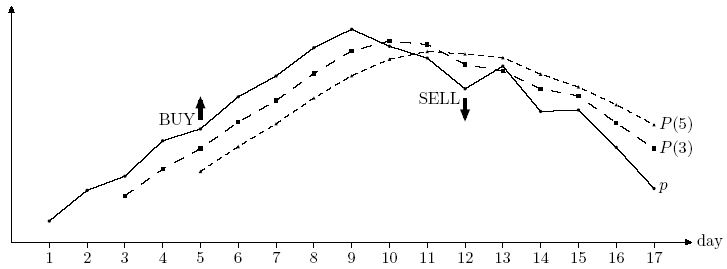
He uses two integer numbers m and n (1 <= m < n <= 100) as parameters of his trading strategy. Every day he computes two numbers: P(m) -- an average stock price for the previous m days, and P(n) — an average stock price for the previous n days. P(m) > P(n)
is an indicator of the upward trend (traders call it bullish trend), and P(m) < P(n) is an indicator of the downward trend (traders call it bearish trend). In practice the values for P(m) and P(n) are never equal.
When a trend reverses from bearish to bullish it is a signal for Frank to buy stock. When a trend reverses from bullish to bearish it is a signal to sell.
Frank has different values for m and n in mind and he wants to backtest them using historical prices. He takes a set of k (n < k <= 10 000) historical prices pi (0 < pi < 100 for 1 <= i <= k). For each i (n <= i <= k) he computes Pi(m) and Pi(n) — an arithmetic
average of pi-m+1 . . . pi and pi-n+1 . . . pi respectively. Backtesting generates trading signals according to the following rules.
If Pi(m) > Pi(n) there is a bullish trend for day i and a "BUY ON DAY i" signal is generated if i = n or there was a bearish trend on day i - 1.
If Pi(m) < Pi(n) there is a bearish tread for day i and a "SELL ON DAY i" signal is generated if i = n or there was a bullish trend on day i - 1.
Your task is to write a program that backtests a specified strategy for Frank -- you shall print a signal for the first tested day (day n) followed by the signals in increasing day numbers.
Input
The first line of the input contains three integer numbers m, n, and k. It is followed by k lines with stock prices for days 1 to k. Each stock price pi is specified with two digits after decimal point. Prices in the input file are such that Pi(m) != Pi(n)
for all i (n <= i <= k).
Output
Write to the output a list of signals -- one signal on a line, as described in the problem statement.
Sample Input
Sample Output
Source
Northeastern Europe 2004
一个数组有k个元素,分别从第m个元素和第n个元素开始比较该元素之前的m、n个元素的平均值大小为p(m)、p(n)。如果p(m)>p(n)则当前的趋势为bullish tread,若i=n或i-1元素时为bearish tread,则输出"BUY ON DAY i";如果p(m)<p(n)则当前的趋势为bearish tread,若i=n或i-1元素时为bullish
tread,则输出"SELL ON DAY i"。实时取值,比较后输出。分别用flag标记当前状态,-1为初始状态,0为bearish trend,1为bullish trend。
代码(1AC):
| Time Limit: 1000MS | Memory Limit: 65536K | |||
| Total Submissions: 1457 | Accepted: 657 | Special Judge |
Frank is a professional stock trader for Advanced Commercial Markets Limited (ACM Ltd). He likes "easy trading" -- using a straightforward strategy to decide when to buy stock and when to sell it. Frank has a database of historical stock prices for each day.
He uses two integer numbers m and n (1 <= m < n <= 100) as parameters of his trading strategy. Every day he computes two numbers: P(m) -- an average stock price for the previous m days, and P(n) — an average stock price for the previous n days. P(m) > P(n)
is an indicator of the upward trend (traders call it bullish trend), and P(m) < P(n) is an indicator of the downward trend (traders call it bearish trend). In practice the values for P(m) and P(n) are never equal.
When a trend reverses from bearish to bullish it is a signal for Frank to buy stock. When a trend reverses from bullish to bearish it is a signal to sell.
Frank has different values for m and n in mind and he wants to backtest them using historical prices. He takes a set of k (n < k <= 10 000) historical prices pi (0 < pi < 100 for 1 <= i <= k). For each i (n <= i <= k) he computes Pi(m) and Pi(n) — an arithmetic
average of pi-m+1 . . . pi and pi-n+1 . . . pi respectively. Backtesting generates trading signals according to the following rules.
If Pi(m) > Pi(n) there is a bullish trend for day i and a "BUY ON DAY i" signal is generated if i = n or there was a bearish trend on day i - 1.
If Pi(m) < Pi(n) there is a bearish tread for day i and a "SELL ON DAY i" signal is generated if i = n or there was a bullish trend on day i - 1.
Your task is to write a program that backtests a specified strategy for Frank -- you shall print a signal for the first tested day (day n) followed by the signals in increasing day numbers.
Input
The first line of the input contains three integer numbers m, n, and k. It is followed by k lines with stock prices for days 1 to k. Each stock price pi is specified with two digits after decimal point. Prices in the input file are such that Pi(m) != Pi(n)
for all i (n <= i <= k).
Output
Write to the output a list of signals -- one signal on a line, as described in the problem statement.
Sample Input
3 5 17
8.45
9.10
9.40
10.15
10.40
11.08
11.52
12.12
12.51
12.15
11.90
11.25
11.73
10.77
10.80
10.01
9.14
Sample Output
BUY ON DAY 5
SELL ON DAY 12
Source
Northeastern Europe 2004
一个数组有k个元素,分别从第m个元素和第n个元素开始比较该元素之前的m、n个元素的平均值大小为p(m)、p(n)。如果p(m)>p(n)则当前的趋势为bullish tread,若i=n或i-1元素时为bearish tread,则输出"BUY ON DAY i";如果p(m)<p(n)则当前的趋势为bearish tread,若i=n或i-1元素时为bullish
tread,则输出"SELL ON DAY i"。实时取值,比较后输出。分别用flag标记当前状态,-1为初始状态,0为bearish trend,1为bullish trend。
代码(1AC):
#include <cstdio>
#include <cstdlib>
#include <cstring>

double arr[11000];

int main(void){
int m, n, k;
int i, j;
double pm, pn;
int flag; // 1 bullish trend ; 0 bearish trend

while (scanf("%d%d%d", &m, &n, &k) != EOF){
flag = -1;
memset(arr, 0, sizeof(arr));
pm = pn = 0;
for (i = 0; i < k; i++){
scanf("%lf", &arr[i]);
if (i < m - 1){
pm += arr[i];
}
else{
pm -= arr[i - m];
pm += arr[i];
}
if (i < n - 1){
pn += arr[i];
}
else{
pn -= arr[i - n];
pn += arr[i];
if (pm / m > pn / n && flag != 1){
printf("BUY ON DAY %d\n", i + 1);
flag = 1;
}
if (pm / m < pn / n && flag != 0){
printf("SELL ON DAY %d\n", i + 1);
flag = 0;
}
}
}
}
return 0;
}

相关文章推荐
- POJ 1247 Magnificent Meatballs(我的水题之路——数组两边求和)
- POJ 2070 Filling Out the Team(我的水题之路——double比较)
- POJ 3030 Nasty Hacks(我的水题之路——比较大小)
- POJ 1250 Tanning Salon(我的水题之路——字母表数组标记)
- POJ 1552 Double(我的水题之路——二重循环正逆比较)
- POJ 2575 Jolly Jumpers(我的水题之路——数组绝对差值为1到n-1)
- POJ 1580 String Matching(我的水题之路——字符串公共子串的比较雏形)
- POJ 2579 Blurred Vision(我的水题之路——四方格平均值)
- 奇偶数分离(水题)---引发String和数组的比较
- POJ 1318 Word Amalgamation(我的水题之路——乱序字母匹配)
- POJ 1493 Machined Surfaces(我的水题之路——移动后的空格)
- POJ 2459 Feed Accounting(我的水题之路——英文题啊!!!)
- POJ 2636 Electrical Outlets(我的水题之路——水,电器接头)
- POJ 3006 Dirichlet's Theorem on Arithmetic Progressions(我的水题之路——加i个d后的第几个素数)
- POJ 3427 Ecology tax(我的水题之路——不同的理解,不同的AC)
- POJ 1488 TEX Quotes(我的水题之路——暴水,字符转换)
- POJ 1595 Prime Cuts(我的水题之路——素数取中间区域,准确定位)
- POJ 2128 Highways(我的水题之路——最小两条公路之和)
- POJ 2350 Above Average(我的水题之路——%lf输出报错)
- POJ 3183 Stump Removal(我的水题之路——高峰烧火,在线判断)