vCenter and Memory metrics (由VCenter管理的ESX的内存指标分析)
2012-02-02 14:41
411 查看
vCenter
and Memory metrics
Added Dec 20, 2010, By Duncan
Epping with 36
Comments
I received a question last week from a former colleague around some of the memory details in vCenter. There are a couple of places where memory details are shown on a “VM level” within the vCenter client. The first tab that we will discuss is the Summary tab.
It shows “General” and “Resources”. It appears that there is a lot of confusion around this topic and that probably comes from the fact that some of the Performance Metrics are named similarly but don’t always refer to the same.
Lets start with “General”:

In the screenshot above you can see 2 fields related to memory:
Memory (2048MB)
Memory Overhead (110.63MB)
The first one, Memory, is an easy one. This is the amount of memory
you provisioned your VM with, in this case 2048MB. The second field is Memory
Overhead. Memory Overhead is the amount of memory the VMkernel thinks it will need to run the virtualized workload, in this case 110.63MB. This typicall would include things like page tables, frame buffers etc.
That brings us to the Resources sections:
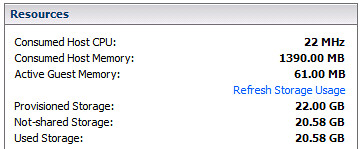
This section shows again two fields related to memory:
Consumed Host Memory (1390.00MB)
Active Guest Memory (61.00MB)
Consumed and Active is where it becomes a bit less obvious but again it isn’t rocket science. Consumed
Host Memory is the amount of physical memory that has been allocated to the virtual machine. This also includes things like memory overhead, that also means that Consumed can be larger than what has been provisioned. To make it a bit more complex it
should be noted that in the “Performance Tab” the “Consumed” Counter doesn’t actually include Memory Overhead!
Active Memory more or less already explains it, it is what the VMkernel
believes is currently being actively used by the VM. Now it should be pointed out here that this is an estimate calculated by a form of statistical sampling.
The second tab that contains details around memory is “Resource Allocation”. Looking at the tab I guess it is obvious that this one contains more details and is more complex than the summary tab:
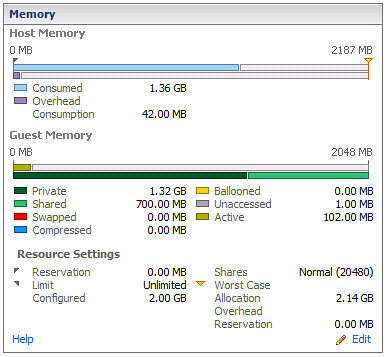
The Memory section contains three sub-sections and I have carved them up as such:
The first section is the host memory:
Consumed (1.36GB)
Overhead Consumption (42.00MB)
Again, Consumed is the amount of machine memory currently allocated
to the VM. In other words, out of the 2GB provisioned currently 1.36GB is being consumed by that VM. TheOverhead
Consumption is the amount of memory being consumed for the virtualization overhead, as you can see it is less than what the VMkernel expected to use as mentioned in the first screenshot. I guess you could do the math easily:
Consumed = Private + Overhead Consumption
Guest Memory
Private (1.32GB)
Shared (700.00MB)
Swapped (0.00MB)
Compressed (0.00MB)
Ballooned (0.00MB)
Unaccessed (1.00MB)
Active (102.00MB)
This is the part where it gets slightly more complicated. Private is
the amount of memory that is physically backed by the Host. In other words 1.32GB is physically stored. Shared is
the total amount of memory shared by TPS. Swapped, Compressed and Ballooned speak for itself in my opinion but lets be absolutely clear here. Swapped the
amount of memory reclaimed by VMkernel swapping, Compressed is the
amount of memory stored in the VMs compression cache and Ballooned is
the amount of memory reclaimed by the Balloon Driver. Ultimately all of these should be 0.
There’s one which I couldn’t really explain which is Unaccessed. The
documentation describes it as “the amount of memory that has never been referenced by the guest”.Active is
the amount of memory actively used, again it is an estimate done by statistical sampling. (Did you notice it changed from 61MB to 102MB.)
The last section is Resource Settings, I guess most are obvious (like Reservation, Limit, Configured,
Shares) but the two that might not be are:
Worst Case Allocation (2.14GB)
Overhead Reservation (0.00MB)
Worst Case Allocation is the amount of memory that the virtual machine
can allocate when ALL virtual machines consume the full amount of allocated resources. Basically when there is severe overcommitment this is what the VM will get in the worst possible case. This is also one of the key metrics to keep an eye on in my opinion.
Especially when you are over-committing and over-provisioning your systems this metric will be a key-indicator.Overhead
Reservation is the amount of Overhead Memory reserved, not much to say about that one
http://www.vmware.com/support/developer/vc-sdk/visdk400pubs/ReferenceGuide/memory_counters.html#overhead
http://www.yellow-bricks.com/2010/12/20/vcenter-and-memory-metrics/
and Memory metrics
Added Dec 20, 2010, By Duncan
Epping with 36
Comments
I received a question last week from a former colleague around some of the memory details in vCenter. There are a couple of places where memory details are shown on a “VM level” within the vCenter client. The first tab that we will discuss is the Summary tab.
It shows “General” and “Resources”. It appears that there is a lot of confusion around this topic and that probably comes from the fact that some of the Performance Metrics are named similarly but don’t always refer to the same.
Lets start with “General”:
In the screenshot above you can see 2 fields related to memory:
Memory (2048MB)
Memory Overhead (110.63MB)
The first one, Memory, is an easy one. This is the amount of memory
you provisioned your VM with, in this case 2048MB. The second field is Memory
Overhead. Memory Overhead is the amount of memory the VMkernel thinks it will need to run the virtualized workload, in this case 110.63MB. This typicall would include things like page tables, frame buffers etc.
That brings us to the Resources sections:
This section shows again two fields related to memory:
Consumed Host Memory (1390.00MB)
Active Guest Memory (61.00MB)
Consumed and Active is where it becomes a bit less obvious but again it isn’t rocket science. Consumed
Host Memory is the amount of physical memory that has been allocated to the virtual machine. This also includes things like memory overhead, that also means that Consumed can be larger than what has been provisioned. To make it a bit more complex it
should be noted that in the “Performance Tab” the “Consumed” Counter doesn’t actually include Memory Overhead!
Active Memory more or less already explains it, it is what the VMkernel
believes is currently being actively used by the VM. Now it should be pointed out here that this is an estimate calculated by a form of statistical sampling.
The second tab that contains details around memory is “Resource Allocation”. Looking at the tab I guess it is obvious that this one contains more details and is more complex than the summary tab:
The Memory section contains three sub-sections and I have carved them up as such:
The first section is the host memory:
Consumed (1.36GB)
Overhead Consumption (42.00MB)
Again, Consumed is the amount of machine memory currently allocated
to the VM. In other words, out of the 2GB provisioned currently 1.36GB is being consumed by that VM. TheOverhead
Consumption is the amount of memory being consumed for the virtualization overhead, as you can see it is less than what the VMkernel expected to use as mentioned in the first screenshot. I guess you could do the math easily:
Consumed = Private + Overhead Consumption
Guest Memory
Private (1.32GB)
Shared (700.00MB)
Swapped (0.00MB)
Compressed (0.00MB)
Ballooned (0.00MB)
Unaccessed (1.00MB)
Active (102.00MB)
This is the part where it gets slightly more complicated. Private is
the amount of memory that is physically backed by the Host. In other words 1.32GB is physically stored. Shared is
the total amount of memory shared by TPS. Swapped, Compressed and Ballooned speak for itself in my opinion but lets be absolutely clear here. Swapped the
amount of memory reclaimed by VMkernel swapping, Compressed is the
amount of memory stored in the VMs compression cache and Ballooned is
the amount of memory reclaimed by the Balloon Driver. Ultimately all of these should be 0.
There’s one which I couldn’t really explain which is Unaccessed. The
documentation describes it as “the amount of memory that has never been referenced by the guest”.Active is
the amount of memory actively used, again it is an estimate done by statistical sampling. (Did you notice it changed from 61MB to 102MB.)
The last section is Resource Settings, I guess most are obvious (like Reservation, Limit, Configured,
Shares) but the two that might not be are:
Worst Case Allocation (2.14GB)
Overhead Reservation (0.00MB)
Worst Case Allocation is the amount of memory that the virtual machine
can allocate when ALL virtual machines consume the full amount of allocated resources. Basically when there is severe overcommitment this is what the VM will get in the worst possible case. This is also one of the key metrics to keep an eye on in my opinion.
Especially when you are over-committing and over-provisioning your systems this metric will be a key-indicator.Overhead
Reservation is the amount of Overhead Memory reserved, not much to say about that one
http://www.vmware.com/support/developer/vc-sdk/visdk400pubs/ReferenceGuide/memory_counters.html#overhead
http://www.yellow-bricks.com/2010/12/20/vcenter-and-memory-metrics/

相关文章推荐
- SQL Server ->> Memory Allocation Mechanism and Performance Analysis(内存分配机制与性能分析)之 -- Minimum server memory与Maximum server memory
- 使用JetBrains dotMemory 4.0分析内存
- Android窗口管理分析(4):Android View绘制内存的分配、传递、使用
- .NET Framework 自动内存管理机制深入剖析 (C#分析篇)(转)
- Gustavo Duarte: 内核怎么管理内存(how-the-kernel-manages-your-memory)
- Oracle内存全面分析(2)-1Oracle 的内存架构组成_1SGA.2Buffer cache的管理、参数以及相关视图
- Unity5.3a4新版内存分析工具 -MemoryProfiler
- Java常见内存溢出异常分析(OutOfMemoryError)
- 关于matlab高效管理内存的方法,进而降低Out of Memory出现的机率
- c++ 内存分配过程(通过汇编,寄存器和Memory分析)
- JVM NativeMemoryTracking 分析堆外内存泄露
- 2、lib7z-Memory从内存或网络解压数据(分析源码,修改源码)
- MySQL系列:innodb源代码分析之内存管理
- Java常见内存溢出异常分析(OutOfMemoryError)
- Netty4源码分析之内存管理
- 内存溢出分析:OutOfMemoryError异常
- 内存分析工具MAT(MemoryAnalyzerTool)
- Boost.Interprocess使用手册翻译之八:分配器,容器和内存分配算法(Allocators, containers and memory allocation algorithms)
- memcached空指针内存错误与死循环问题分析(memcached dead loop and crash bug! issue #260 and issue #370)
- 内存分布和栈空间---Memory Layout And The Stack