.net垃圾回收学习[Best Practices No 5: Detecting .NET application memory leaks][翻译&&学习]]
2011-09-18 13:14
681 查看
From:http://www.c-sharpcorner.com/UploadFile/shivprasadk/BestPractices509292009045327AM/BestPractices5.aspx
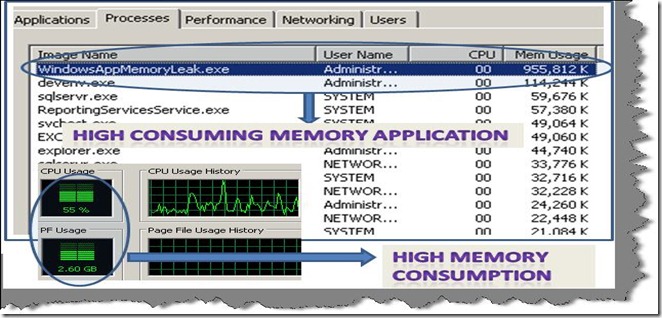
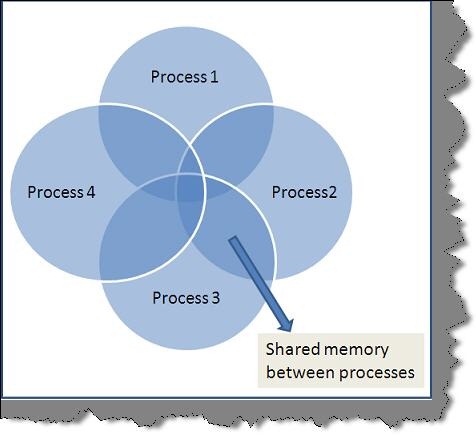
先看看为什么内存管理器提供信息误导性较大。内存管理器显示的是Working Set的内存而不是实际上使用的内存,working set内存指的的是那些分配的内存而不是使用了的内存。Adding further some memory from working set can be shared by other processes/applications.
可以通过如下步骤在性能管理器中观察performance counter:
Start you application which has memory leak and keep it running.
Click start and Goto run and type 'perfmon'.
Delete all the current performance counters by selecting the counter and deleting the same by hitting the delete button.
Right click and select 'Add counters' and select 'process' from performance object.
From the counter list select 'Private bytes'.
From the instance list select the application which you want to test memory leak for.
假如你的应用程序的private bytes是呈直线上升状的,这意味着存在内存泄漏.如下图:
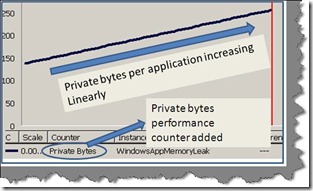
为了查看是否存在内存泄漏,需要连续若干小时或者几天的运行Performance counter.
what: 查看什么类型的数据导致的。
how: 怎么导致的内存泄漏
where: 哪段代码逻辑或者程序导致的内存泄漏。
.net的内存组成如上,所以首先需要确认是托管还是非托管的内存泄漏,需要采用performance counter来进行观察:
第一个计数器是: private types
第二个计数器是: bytes in all heaps .
Bytes in all heaps are the memory consumed by the managed code
可以做如下判定:
假如private bytes一直在增长,bytes in all heaps是个常量的话,那么是一个unmanged memory leak
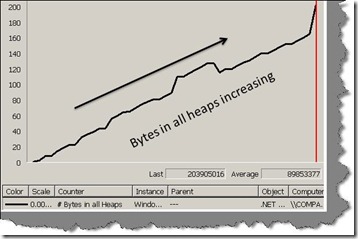
假如bytes in all heaps一直在增长,那么是一个managed memory leak.
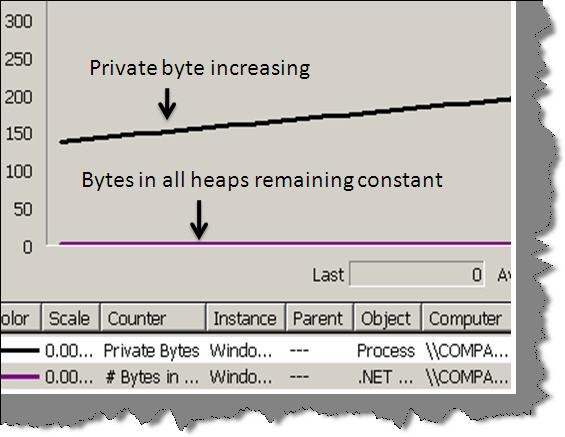
下图是一个非托管资源的泄漏
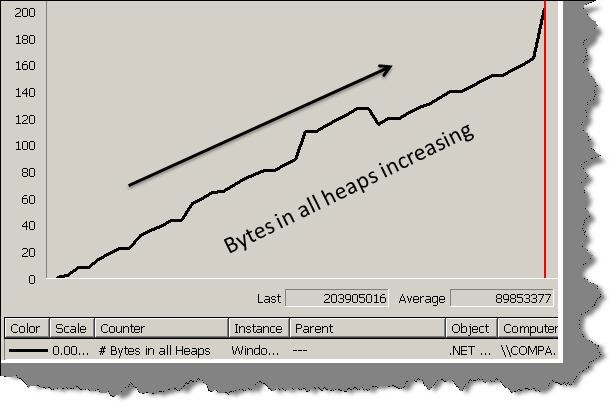
下图是一个托管资源的泄漏
private void timerUnManaged_Tick(object sender, EventArgs e)
{
Marshal.AllocHGlobal(7000);
}
It's very difficult to inject a managed leak as GC ensures that the memory is reclaimed. In order to keep things simple we simulate a managed memory leak by creating lot of brush objects and adding them to a list which is a class level variable. It's a simulation and not a managed leak. Once the application is closed this memory will be reclaimed.
private void timerManaged_Tick(object sender, EventArgs e)
{
for (int i = 0; i < 10000; i++)
{
Brush obj = new SolidBrush(Color.Blue);
objBrushes.Add(obj);
}
}
In case you are interested to know how leaks can happen in managed memory you can refer to weak handler for more information http://msdn.microsoft.com/en-us/library/aa970850.aspx .
The next step is to download 'debugdiag' tool from http://www.microsoft.com/DOWNLOADS/details.aspx?FamilyID=28bd5941-c458-46f1-b24d-f60151d875a3&displaylang=en
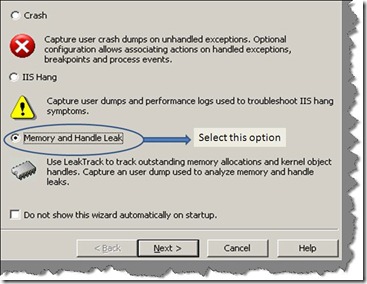
Start the debug diagnostic tool and select 'Memory and handle leak' and click next.
这个地方比较有意思的是,SolidBrush到底是托管资源还是非托管资源?应该说这个一个包含了非托管资源的托管类型。
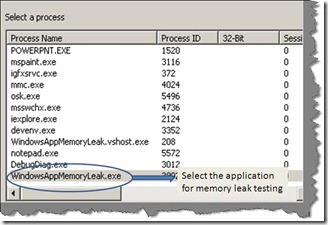
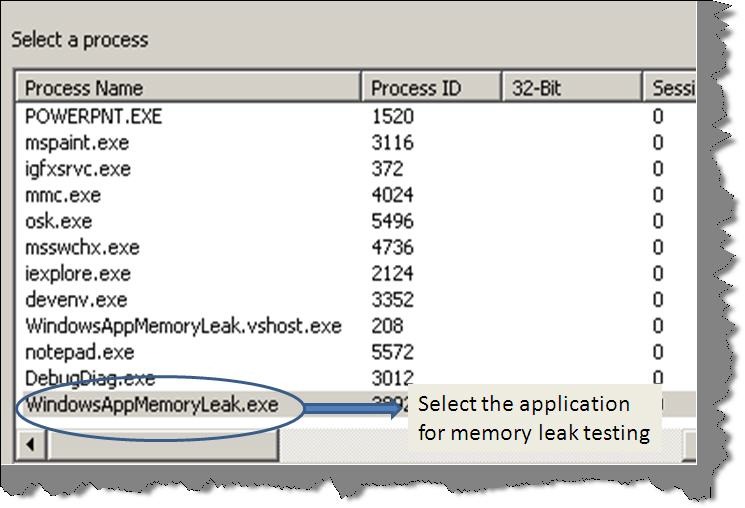
Select the process in which you want to detect memory leak.
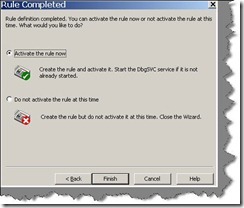
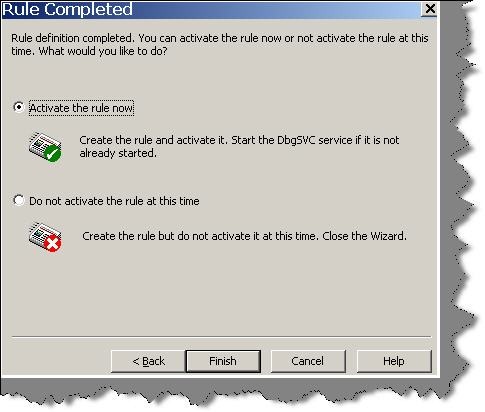
Finally select 'Activate the rule now'.
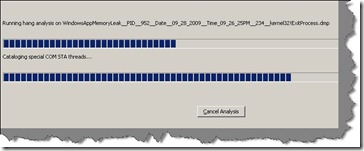
Now let the application run and 'Debugdiag' tool will run at the backend monitoring memory issues.
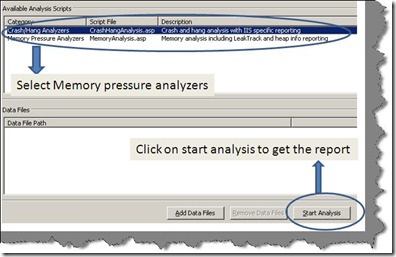
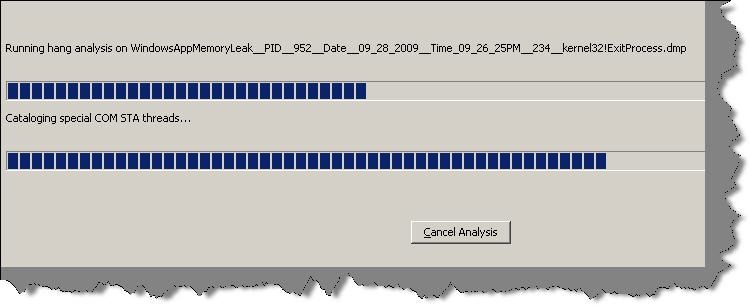
Once done click on start analysis and let the tool do the analysis.
You should get a detail HTML report which shows how unmanaged memory was allocated. In our code we had allocated huge unmanaged memory using 'AllochGlobal' which is shown in the report below.
Type
Description
Warning
mscorlib.ni.dll is responsible for 3.59 MBytes worth of outstanding allocations. The following are the top 2 memory consuming functions:
System.Runtime.InteropServices.Marshal.AllocHGlobal(IntPtr): 3.59 MBytes worth of outstanding allocations.
Warning
ntdll.dll is responsible for 270.95 KBytes worth of outstanding allocations. The following are the top 2 memory consuming functions:
ntdll!RtlpDphNormalHeapAllocate+1d: 263.78 KBytes worth of outstanding allocations.
ntdll!RtlCreateHeap+5fc: 6.00 KBytes worth of outstanding allocations.
Managed memory leak of brushes are shown using 'GdiPlus.dll' in the below HTML report.
Type
Description
Warning
GdiPlus.dll is responsible for 399.54 KBytes worth of outstanding allocations.
The following are the top 2 memory consuming functions:
GdiPlus!GpMalloc+16: 399.54 KBytes worth of outstanding allocations.
Where is the memory leak? Once you know what the source of a memory leak is, it's time to find out which logic is causing the memory leak. There is no automated tool to detect logic which caused memory leaks. You need to manually go in your code and take the pointers provided by 'debugdiag' to conclude in which places the issues are.
For instance from the report it's clear that 'AllocHGlobal' is causing the unmanaged leak while one of the objects of GDI is causing the managed leak. Using these details we need to go to them in the code to see where exactly the issue lies.
Source code You can download the source code from the top of this article which can help you inject memory leak.
Thanks, Thanks and Thanks It would be unfair on my part to say that the above article is completely my knowledge. Thanks for all the lovely people that have written articles so that one day someone like me can be benefit.
http://blogs.msdn.com/tess/ A great blog by a lovely lady Tess on debuggers. There are some great labs on memory leak detection using windbg; do not miss it. Tess god bless you, your blog rocks like anything.
http://msdn.microsoft.com/en-us/magazine/cc163491.aspx This is a great article by James kovacs on managed and unmanaged memory leaks, must to read.
http://davybrion.com/blog/2009/08/finding-memory-leaks-in-silverlight-with-windbg/ Great article on finding memory leaks using windbg.
http://www.itwriting.com/dotnetmem.php :- Great link which explains in detail the difference between working set memory and private bytes.
http://www.microsoft.com/DOWNLOADS/details.aspx?FamilyID=28bd5941-c458-46f1-b24d-f60151d875a3&displaylang=en Download for the debugdiag tool.
http://blogs.msdn.com/davidklinems/archive/2005/11/16/493580.aspx David Kline explains the 3 common causes of memory leak in managed application.
My other .NET best practices article .NET best practice 1:- In this article we discuss about how we can find high memory consumption areas in .NET. You can read about the same at .NET best practice 1
.NET best practice 2:- In this article we discuss how we can improve performance using finalize / dispose pattern. .NET best practice 2
.NET best practice 3:- How can we use performance counters to gather performance data from .NET applications .NET best practice 3
.NET best practice 4 :- How can we improve bandwidth performance using IIS compression .NET best practice 4.
Avoid task manager to detect memory leak
首先需要确认是不是存在内存泄漏。很多程序员使用任务管理器进行内存泄漏的确认,但是内存管理器不仅仅很容易误导,也会给出来错误的信息。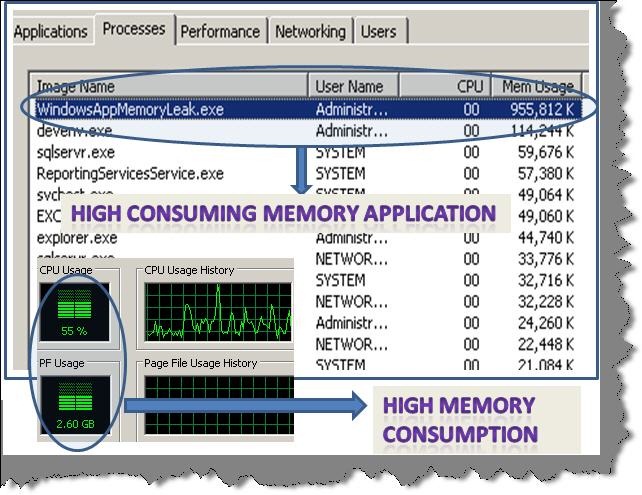
先看看为什么内存管理器提供信息误导性较大。内存管理器显示的是Working Set的内存而不是实际上使用的内存,working set内存指的的是那些分配的内存而不是使用了的内存。Adding further some memory from working set can be shared by other processes/applications.
Using private bytes performance counters to detect memory leak
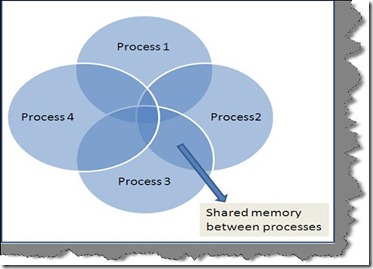
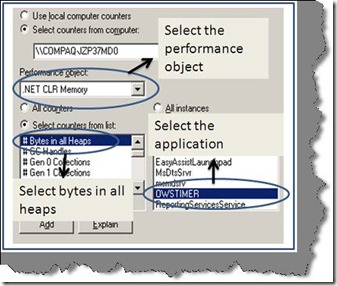
为了得到应用程序使用的内存我们需要跟踪应用程序消耗的private bytes. private bytes是没有被其他应用程序共享的区域,我们可以通过performance counter得到private bytes.可以通过如下步骤在性能管理器中观察performance counter:
Start you application which has memory leak and keep it running.
Click start and Goto run and type 'perfmon'.
Delete all the current performance counters by selecting the counter and deleting the same by hitting the delete button.
Right click and select 'Add counters' and select 'process' from performance object.
From the counter list select 'Private bytes'.
From the instance list select the application which you want to test memory leak for.
假如你的应用程序的private bytes是呈直线上升状的,这意味着存在内存泄漏.如下图:
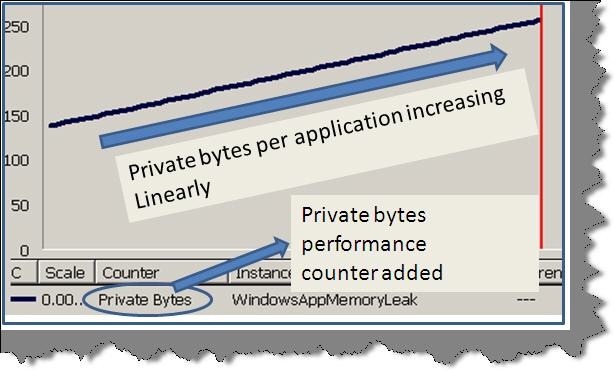
为了查看是否存在内存泄漏,需要连续若干小时或者几天的运行Performance counter.
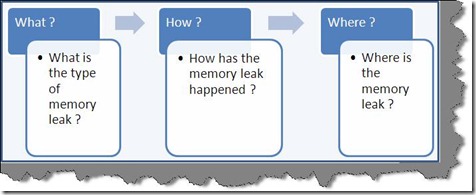
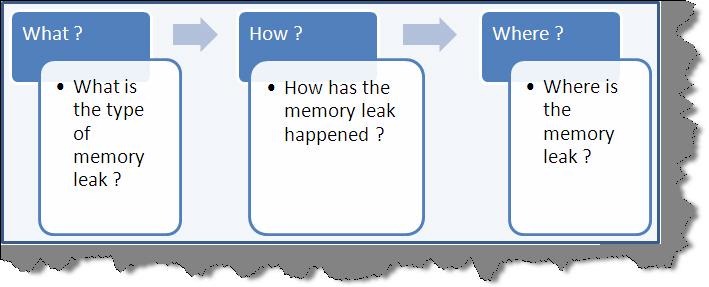
3 step process to investigate memory leak
可以采用三个步骤来确定是什么地方出现了内存泄漏;what: 查看什么类型的数据导致的。
how: 怎么导致的内存泄漏
where: 哪段代码逻辑或者程序导致的内存泄漏。
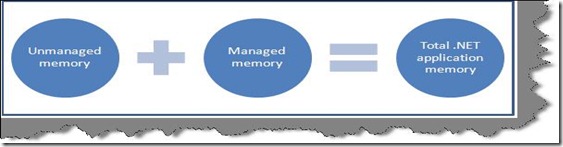
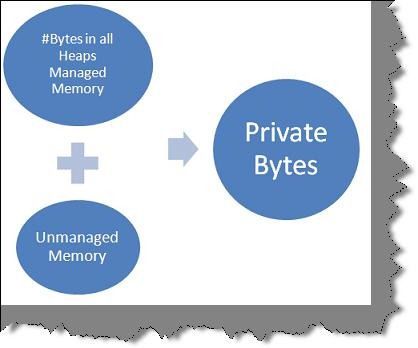
What is the type of memory leak? Total Memory = Managed memory + unmanaged memory
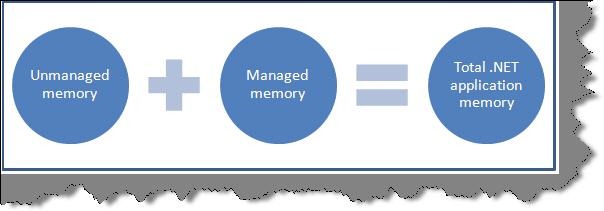
.net的内存组成如上,所以首先需要确认是托管还是非托管的内存泄漏,需要采用performance counter来进行观察:
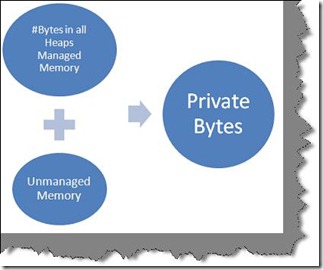
第一个计数器是: private types
第二个计数器是: bytes in all heaps .
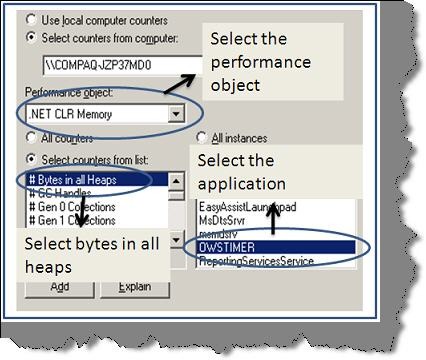
Bytes in all heaps are the memory consumed by the managed code
可以做如下判定:
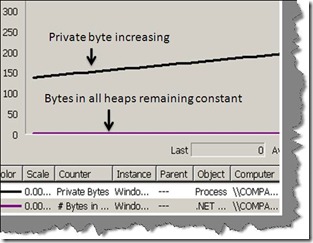
假如private bytes一直在增长,bytes in all heaps是个常量的话,那么是一个unmanged memory leak
假如bytes in all heaps一直在增长,那么是一个managed memory leak.
下图是一个非托管资源的泄漏
下图是一个托管资源的泄漏
How is the memory leak happening?
So let's inject an unmanaged memory leak by calling 'Marshal.AllocHGlobal' function. This function allocates unmanaged memory and thus injecting unmanaged memory leak in the application. This command is run within the timer number of times to cause huge unmanaged leak.private void timerUnManaged_Tick(object sender, EventArgs e)
{
Marshal.AllocHGlobal(7000);
}
It's very difficult to inject a managed leak as GC ensures that the memory is reclaimed. In order to keep things simple we simulate a managed memory leak by creating lot of brush objects and adding them to a list which is a class level variable. It's a simulation and not a managed leak. Once the application is closed this memory will be reclaimed.
private void timerManaged_Tick(object sender, EventArgs e)
{
for (int i = 0; i < 10000; i++)
{
Brush obj = new SolidBrush(Color.Blue);
objBrushes.Add(obj);
}
}
In case you are interested to know how leaks can happen in managed memory you can refer to weak handler for more information http://msdn.microsoft.com/en-us/library/aa970850.aspx .
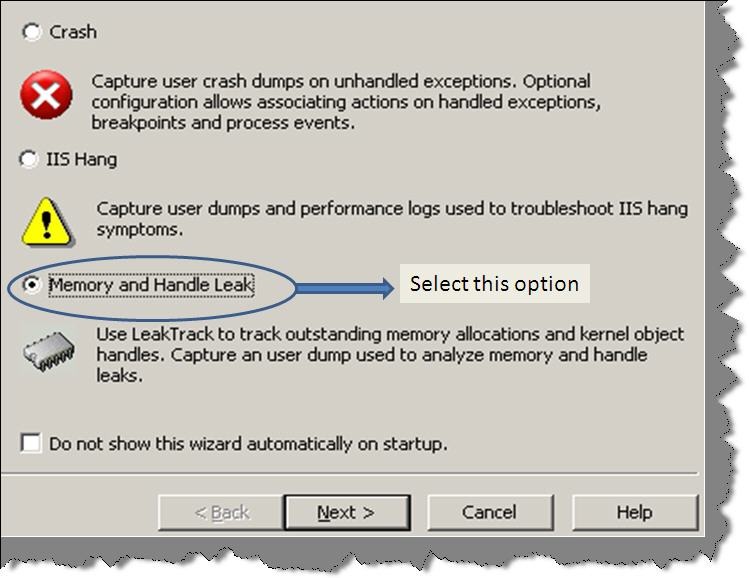
The next step is to download 'debugdiag' tool from http://www.microsoft.com/DOWNLOADS/details.aspx?FamilyID=28bd5941-c458-46f1-b24d-f60151d875a3&displaylang=en
Start the debug diagnostic tool and select 'Memory and handle leak' and click next.
这个地方比较有意思的是,SolidBrush到底是托管资源还是非托管资源?应该说这个一个包含了非托管资源的托管类型。
Select the process in which you want to detect memory leak.
Finally select 'Activate the rule now'.
Now let the application run and 'Debugdiag' tool will run at the backend monitoring memory issues.
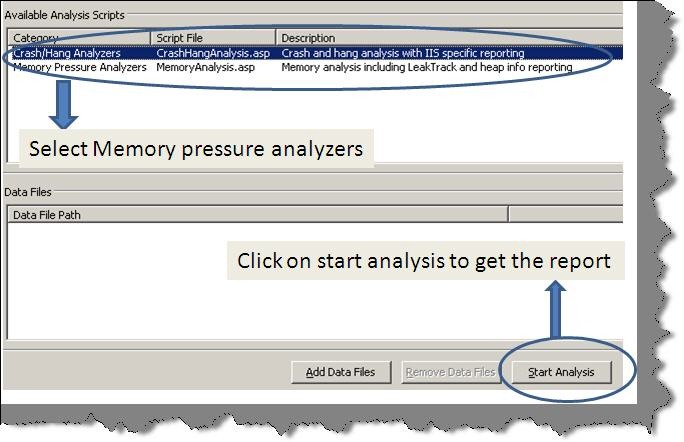
Once done click on start analysis and let the tool do the analysis.
You should get a detail HTML report which shows how unmanaged memory was allocated. In our code we had allocated huge unmanaged memory using 'AllochGlobal' which is shown in the report below.
Type
Description
Warning
mscorlib.ni.dll is responsible for 3.59 MBytes worth of outstanding allocations. The following are the top 2 memory consuming functions:
System.Runtime.InteropServices.Marshal.AllocHGlobal(IntPtr): 3.59 MBytes worth of outstanding allocations.
Warning
ntdll.dll is responsible for 270.95 KBytes worth of outstanding allocations. The following are the top 2 memory consuming functions:
ntdll!RtlpDphNormalHeapAllocate+1d: 263.78 KBytes worth of outstanding allocations.
ntdll!RtlCreateHeap+5fc: 6.00 KBytes worth of outstanding allocations.
Managed memory leak of brushes are shown using 'GdiPlus.dll' in the below HTML report.
Type
Description
Warning
GdiPlus.dll is responsible for 399.54 KBytes worth of outstanding allocations.
The following are the top 2 memory consuming functions:
GdiPlus!GpMalloc+16: 399.54 KBytes worth of outstanding allocations.
Where is the memory leak? Once you know what the source of a memory leak is, it's time to find out which logic is causing the memory leak. There is no automated tool to detect logic which caused memory leaks. You need to manually go in your code and take the pointers provided by 'debugdiag' to conclude in which places the issues are.
For instance from the report it's clear that 'AllocHGlobal' is causing the unmanaged leak while one of the objects of GDI is causing the managed leak. Using these details we need to go to them in the code to see where exactly the issue lies.
Source code You can download the source code from the top of this article which can help you inject memory leak.
Thanks, Thanks and Thanks It would be unfair on my part to say that the above article is completely my knowledge. Thanks for all the lovely people that have written articles so that one day someone like me can be benefit.
http://blogs.msdn.com/tess/ A great blog by a lovely lady Tess on debuggers. There are some great labs on memory leak detection using windbg; do not miss it. Tess god bless you, your blog rocks like anything.
http://msdn.microsoft.com/en-us/magazine/cc163491.aspx This is a great article by James kovacs on managed and unmanaged memory leaks, must to read.
http://davybrion.com/blog/2009/08/finding-memory-leaks-in-silverlight-with-windbg/ Great article on finding memory leaks using windbg.
http://www.itwriting.com/dotnetmem.php :- Great link which explains in detail the difference between working set memory and private bytes.
http://www.microsoft.com/DOWNLOADS/details.aspx?FamilyID=28bd5941-c458-46f1-b24d-f60151d875a3&displaylang=en Download for the debugdiag tool.
http://blogs.msdn.com/davidklinems/archive/2005/11/16/493580.aspx David Kline explains the 3 common causes of memory leak in managed application.
My other .NET best practices article .NET best practice 1:- In this article we discuss about how we can find high memory consumption areas in .NET. You can read about the same at .NET best practice 1
.NET best practice 2:- In this article we discuss how we can improve performance using finalize / dispose pattern. .NET best practice 2
.NET best practice 3:- How can we use performance counters to gather performance data from .NET applications .NET best practice 3
.NET best practice 4 :- How can we improve bandwidth performance using IIS compression .NET best practice 4.

相关文章推荐
- .net垃圾回收学习【NET Best Practice No: 1:- Detecting High Memory consuming functions in .NET code】【翻译&&学习】
- .net垃圾回收学习【.NET Best Practice No: 2:- Improve garbage collector performance using finalize/dispose pattern】【翻译&&学习】
- .net垃圾回收学习【NET Best Practice No: 3:- Using performance counters to gather performance data】【翻译&&学习】
- .net垃圾回收学习【Back to Basics: Memory leaks in managed systems】【翻译&&学习】
- .net 垃圾回收学习[NET 2.0 Performance Guidelines - String Operations]【翻译&&学习】
- .net 垃圾回收学习[http://www.codeproject.com/KB/dotnet/idisposable.aspx][翻译&&学习][2]
- .net 垃圾回收学习[http://www.codeproject.com/KB/dotnet/idisposable.aspx][翻译&&学习][2]
- .net 垃圾回收学习[http://www.codeproject.com/KB/dotnet/idisposable.aspx][翻译&&学习][2]
- .net 垃圾回收学习【Memory leak via event handlers】【翻译&&学习】
- .net垃圾回收学习【Back to basics: Why use garbage collection】【翻译&&学习】
- .net垃圾回收学习【IDisposable: What Your Mother Never Told You About Resource Deallocation】[翻译&学习]
- .net 垃圾回收学习[Back To Basics: How does the GC find object references][翻译&&学习]
- .net垃圾回收学习[NET 2.0 Performance Guidelines - Garbage Collection][翻译加学习]【2】
- .net 垃圾回收学习[How To: Use CLR Profiler][翻译&&学习]【3】
- .net垃圾回收学习[Back to Bascis: Generational garbage collection][翻译&&学习]
- .net垃圾回收学习【C# 中的Stack和Heap】【翻译&&学习】
- .net 垃圾回收学习[How To: Use CLR Profiler][翻译&&学习]【2】
- .net垃圾回收学习[NET 2.0 Performance Guidelines - Garbage Collection][翻译加学习]
- .net 垃圾回收学习[How To: Use CLR Profiler][翻译&&学习]
- .net 垃圾回收学习【.net 框架程序设计】[CH19: 自动内存管理]