oracle 9i 性能调优2
2011-08-21 16:53
375 查看
五、Tuning
the Buffer Cache
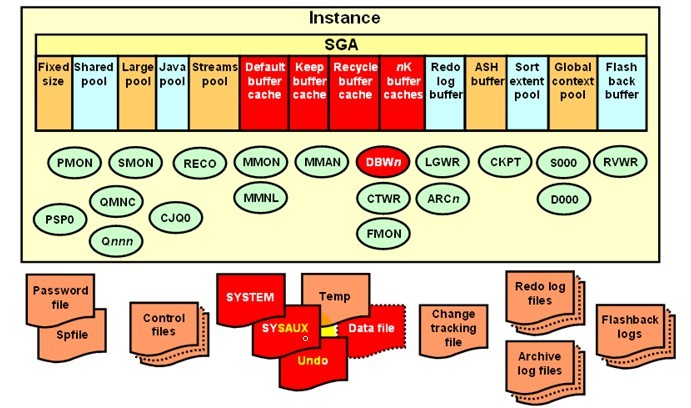
1、Oracle Architecture
2、Default buffer cache
db_cache_advice
v$db_cache_advice
select name,size_for_estimate,estd_physical_read_factor,estd_physical_reads
from v$db_cache_advice order by name,size_for_estimate;
select size_for_estimate,buffers_for_estimate,estd_physical_read_factor,estd_physical_reads
from v$db_cache_advice
where name ='DEFAULT' and block_size=(select value from v$parameter where name ='db_block_size') and advice_status='ON';
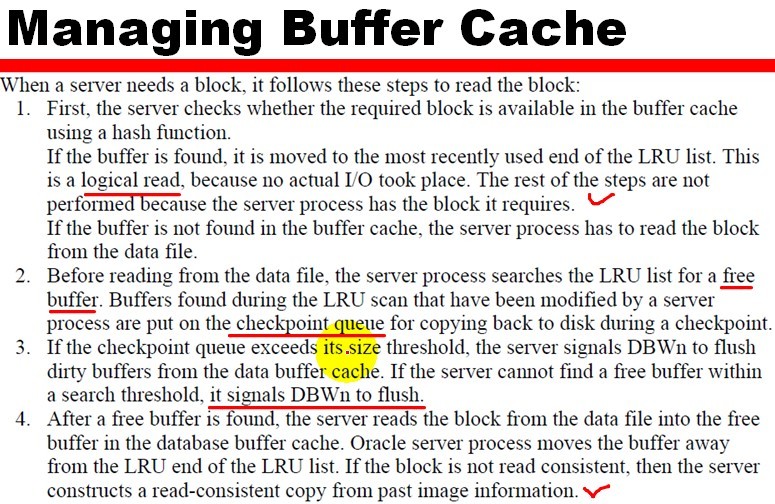
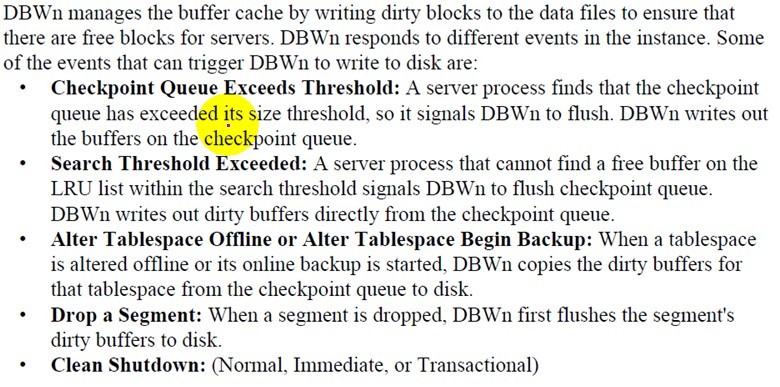
3、Managing Buffer Cache

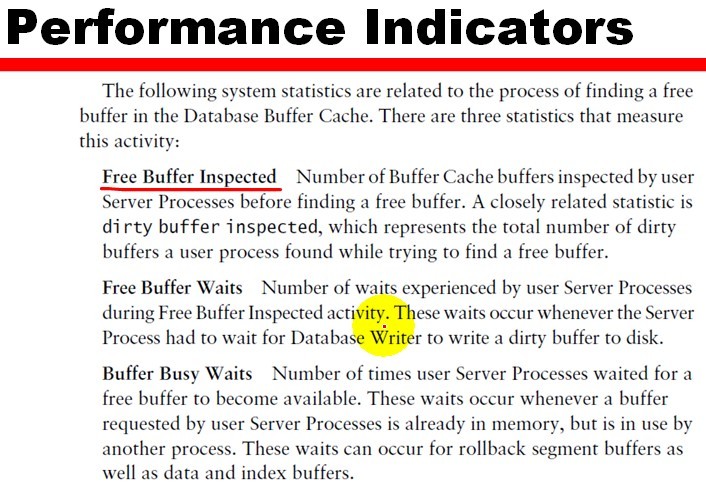
4、Performance Indicators
--v$sysstat
select name,value from v$sysstat where name ='free buffer inspected';
--v$system_event
select event,total_waits from v$system_event where event in ('free buffer waits','buffer busy waits');
--v$event_name
select * from v$event_name where name='buffer busy waits';
--v$session_wait
select * from v$session_wait;
5、Measuring Cache Hit Ratio
--v$sysstat --oracle9i
select 1-(phy.value - lob.value - dir.value) / ses.value "CACHE HIT RATIO"
from v$sysstat ses, v$sysstat lob, v$sysstat dir, v$sysstat phy
where ses.name = 'session logical reads'
and dir.name = 'physical reads direct'
and lob.name='physical reads direct (lob)'
and phy.name='physical reads';

select name,value
from v$sysstat
where name in ('db block gets from cache','consistent gets from cache', 'physical reads cache');
-- v$session_wait
-- v$session_event
--v$system_event
6、How Many Buffer in the Pool?
select o.object_name,count(*) "Num of Blks"
from dba_objects o, v$bh bh
where o.data_object_id = bh.objd
and o.owner != 'SYS'
group by o.object_name
order by count(*);
1) select data_object_id,object_type
from dba_objects
where object_name = UPPER('segment_name');
2) select count(*) buffers from v$bh where objd = data_object_id_value;
3) select name,block_size,sum(buffers) from v$buffer_pool
group by name,block_size
having sum(buffers) > 0;
4) cache used by segment_name = [buffers(step2) / total buffers(Step3)]
SQL>
execute dbms_stats.gather_table_stats('HR','DEPARTMENTS'); --更新表
PL/SQL procedure successfully completed
SQL> select table_name,blocks from dba_tables
2 where owner='HR' and table_name='DEPARTMENTS';
TABLE_NAME BLOCKS
------------------------------ ----------
DEPARTMENTS 5
SQL>
6、Recycle Buffer Pool
-- v$cache
-- v$sess_io
select s.username,io.block_gets ,io.consistent_gets,io.physical_reads
from v$sess_io io, v$session s
where io.sid = s.sid;
7、Calculating Hit Ratio
-- v$buffer_pool_statistics
select name, 1-(physical_reads /(db_block_gets + consistent_gets)) "HIT_RATIO"
from v$buffer_pool_statistics
where db_block_gets + consistent_gets >0;
-- v$buffer_pool
select id,name,block_size,buffers from v$buffer_pool;
8、Caching Tables
select /*+ CACHE */ item_no, from items;
六、Dynamic
Instance Resizing
1、
select name,block_size,resize_state,current_size,buffers from v$buffer_pool;
七、Sizing
Other SGA Structures
1、Using Dynamic Views
-- v$session_wait
select sid,event,seconds_in_wait,state from v$session_wait where event like 'log buffer space%';
--v$sysstat <%1
Redo Buffer Allocation Retries
Redo Entries
2、Tuning Guidelines
select event,total_waits,time_waited,average_wait
from v$system_event where event like 'log file switch completing%' ;
select event,total_waits,time_waits,average_wait
from v$system_event where event like 'log file switch (check%'
select event,total_waits,time_waits,average_wait
from v$system_event where event like 'log file switch (arch%'
八、Tuning
the Oracle Shared Server
1、Parameters
--dispatchers
--max_dispatchers
--shared_servers
--max_shared_servers
--circuits
--processes
2、Monitoring Dispatchers
-- v$dispatchers
-- v$dispatcher_rate
--v$circuit
select sum(owned) "Clients", sum(busy)*100/(sum(busy)+sum(idle)) "Busy Rate" from v$dispatcher;
select * from v$queue
the Buffer Cache
1、Oracle Architecture
2、Default buffer cache
db_cache_advice
v$db_cache_advice
select name,size_for_estimate,estd_physical_read_factor,estd_physical_reads
from v$db_cache_advice order by name,size_for_estimate;
select size_for_estimate,buffers_for_estimate,estd_physical_read_factor,estd_physical_reads
from v$db_cache_advice
where name ='DEFAULT' and block_size=(select value from v$parameter where name ='db_block_size') and advice_status='ON';
3、Managing Buffer Cache
4、Performance Indicators
--v$sysstat
select name,value from v$sysstat where name ='free buffer inspected';
--v$system_event
select event,total_waits from v$system_event where event in ('free buffer waits','buffer busy waits');
--v$event_name
select * from v$event_name where name='buffer busy waits';
--v$session_wait
select * from v$session_wait;
5、Measuring Cache Hit Ratio
--v$sysstat --oracle9i
select 1-(phy.value - lob.value - dir.value) / ses.value "CACHE HIT RATIO"
from v$sysstat ses, v$sysstat lob, v$sysstat dir, v$sysstat phy
where ses.name = 'session logical reads'
and dir.name = 'physical reads direct'
and lob.name='physical reads direct (lob)'
and phy.name='physical reads';
select name,value
from v$sysstat
where name in ('db block gets from cache','consistent gets from cache', 'physical reads cache');
-- v$session_wait
-- v$session_event
--v$system_event
6、How Many Buffer in the Pool?
select o.object_name,count(*) "Num of Blks"
from dba_objects o, v$bh bh
where o.data_object_id = bh.objd
and o.owner != 'SYS'
group by o.object_name
order by count(*);
1) select data_object_id,object_type
from dba_objects
where object_name = UPPER('segment_name');
2) select count(*) buffers from v$bh where objd = data_object_id_value;
3) select name,block_size,sum(buffers) from v$buffer_pool
group by name,block_size
having sum(buffers) > 0;
4) cache used by segment_name = [buffers(step2) / total buffers(Step3)]
SQL>
execute dbms_stats.gather_table_stats('HR','DEPARTMENTS'); --更新表
PL/SQL procedure successfully completed
SQL> select table_name,blocks from dba_tables
2 where owner='HR' and table_name='DEPARTMENTS';
TABLE_NAME BLOCKS
------------------------------ ----------
DEPARTMENTS 5
SQL>
6、Recycle Buffer Pool
-- v$cache
-- v$sess_io
select s.username,io.block_gets ,io.consistent_gets,io.physical_reads
from v$sess_io io, v$session s
where io.sid = s.sid;
7、Calculating Hit Ratio
-- v$buffer_pool_statistics
select name, 1-(physical_reads /(db_block_gets + consistent_gets)) "HIT_RATIO"
from v$buffer_pool_statistics
where db_block_gets + consistent_gets >0;
-- v$buffer_pool
select id,name,block_size,buffers from v$buffer_pool;
8、Caching Tables
select /*+ CACHE */ item_no, from items;
六、Dynamic
Instance Resizing
1、
select name,block_size,resize_state,current_size,buffers from v$buffer_pool;
七、Sizing
Other SGA Structures
1、Using Dynamic Views
-- v$session_wait
select sid,event,seconds_in_wait,state from v$session_wait where event like 'log buffer space%';
--v$sysstat <%1
Redo Buffer Allocation Retries
Redo Entries
2、Tuning Guidelines
select event,total_waits,time_waited,average_wait
from v$system_event where event like 'log file switch completing%' ;
select event,total_waits,time_waits,average_wait
from v$system_event where event like 'log file switch (check%'
select event,total_waits,time_waits,average_wait
from v$system_event where event like 'log file switch (arch%'
八、Tuning
the Oracle Shared Server
1、Parameters
--dispatchers
--max_dispatchers
--shared_servers
--max_shared_servers
--circuits
--processes
2、Monitoring Dispatchers
-- v$dispatchers
-- v$dispatcher_rate
--v$circuit
select sum(owned) "Clients", sum(busy)*100/(sum(busy)+sum(idle)) "Busy Rate" from v$dispatcher;
select * from v$queue

相关文章推荐
- 【整理】小布老师 ORACLE 9i 性能调优
- oracle 9i 性能调优4
- oracle 9i 性能调优3
- oracle 9i 性能调优1
- Oracle 9i在AIX上的性能调整-性能调优
- oracle 9i 性能调优5
- Oracle SQL性能优化和调优
- 提示、模式-oracle 性能调优之 管理操作系统之解决操作系统问题-by小雨
- Oracle性能调优方法详解
- 通向架构师的道路(第二十四天)之Oracle性能调优
- Oracle性能调优--并行(parallel)
- oracle笔记整理10——性能调优之临时表与物化视图
- Oracle Sql 语句性能调优
- 在RedHat Enterprise Linux 上Oracle 9i的安装配置与调优
- 详解Oracle几种性能调优方法
- 【Maclean技术分享】开Oracle调优鹰眼,深入理解AWR性能报告 第二讲
- Oracle性能调优实践中的几点心得
- oracle sql性能调优
- Oracle兼容之层次查询:层次查询高级特性分析-性能调优
- oracle笔记整理11——性能调优之oracle等待事件与表关联