MVC3-RAZOR尝鲜之漂亮的chart图表
2011-07-27 19:58
399 查看
目录
1 创建一个Chart
2 添加标题
3 添加数据源
3.1 反复调用AddSeries可以添加多个
3.2 重复绑定 3.3 使用xml作为数据源
4 数据绑定
5 添加图注
6 保存数据
7 图表与缓存
8 保存到文件
9 其他
1创建一个Chart
public Chart(
int width,宽度
int height,高度
string theme = null,主题由System.Web.Helpers.ChartTheme 静态类提供
string themePath = null 主题地址 xml格式
);
string text = null, 添加标题
string name = null
//设置唯一标示 System.Web.UI.DataVisualization.Charting.Title object.
);
string chartType = "Column",
//System.Web.UI.DataVisualization.Charting.SeriesChartType 下的枚举值
string chartArea = null,
//获取或设置用于绘制数据系列的 ChartArea 对象(如果有)的名称。
string axisLabel = null, 获取或设置系列的轴标签文本。
string legend = null, 获取或设置与 Legend 对象关联的系列的名称。
int markerStep = 1, //获取或设置用于决定数据点标记的显示频率的值。
IEnumerable xValue = null, x轴的数据源
string xField = null, x轴的数据绑定的字段。
IEnumerable yValues = null, Y轴的数据源
string yFields = null Y轴的数据绑定的字段。
);

同时指定 xValues 和xFields ,xFields优先。
@{var dataSet = new DataSet();
dataSet.ReadXmlSchema(Server.MapPath("/App_Data/data.xsd"));
dataSet.ReadXml(Server.MapPath("/App_Data/data.xml"));
var dataView = new DataView(dataSet.Tables[0]);
new Chart(width: 400, height: 300
, theme: ChartTheme.Vanilla
)
.AddSeries("Default", chartType: "Pie",
xValue: dataView, xField: "Name",
yValues: dataView, yFields: "Sales")
.Write();
}
string xField = null ,x轴字段
);
chart.SaveXml(xmlPath);
int minutesToCache = 20,缓存时间,分钟为单位
bool slidingExpiration = true 是否平滑显示
);
@{
//保存到缓存
var mychart = Chart.GetFromCache("mychartkey");
if (mychart != null) {
mychart.AddTitle("从缓存中读出"+DateTime.Now);
mychart.Write();
} else {
mychart = new Chart(width: 600, height: 400)
.AddTitle("保存进缓存"+DateTime.Now)
.AddSeries(
name: "Employee",
xValue: new[] { "Peter", "Andrew", "Julie", "Mary", "Dave" },
yValues: new[] { "2", "6", "4", "5", "3" })
.Write() ;
mychart.SaveToCache(key: "mychartkey", minutesToCache: 11, slidingExpiration: false);
}
}

8保存到文件
@{//保存到文件
var mychart = new Chart(width: 400, height: 300)
.AddTitle("保存到文件再从文件中读取")
.AddSeries(
name: "Employee",
xValue: new[] { "Peter", "Andrew", "Julie", "Mary", "Dave" },
yValues: new[] { "2", "6", "4", "5", "3" });
var path = "~/Content/Image/mychart.jpg";
var imgpath = Server.MapPath(path);
mychart.Save(path: imgpath, format: "jpeg");
}
<img src="@Href(path)" />

http://msdn.microsoft.com/zh-cn/library/system.web.ui.datavisualization.charting.seriescharttype.aspx
2参考
Series 成员
http://msdn.microsoft.com/zh-cn/library/system.web.ui.datavisualization.charting.series_members.aspx
3源码下载
http://files.cnblogs.com/facingwaller/learn2UseRazor3.rar
之前的是
http://files.cnblogs.com/facingwaller/learn2UseRazor1-2.rar
2 各种图表的具体使用,有些能兼容。
3 来自同学的提醒,似乎还不能精确控制。 在到处的xml中似乎可以比较精确的控制,
但是由于时间问题,不做深入探究。欢迎大家交流。
1 创建一个Chart
2 添加标题
3 添加数据源
3.1 反复调用AddSeries可以添加多个
3.2 重复绑定 3.3 使用xml作为数据源
4 数据绑定
5 添加图注
6 保存数据
7 图表与缓存
8 保存到文件
9 其他
1创建一个Chart
public Chart(
int width,宽度
int height,高度
string theme = null,主题由System.Web.Helpers.ChartTheme 静态类提供
string themePath = null 主题地址 xml格式
);
< DIV class = cnblogs_code >< PRE >< DIV > <!--<br /><br />Code highlighting produced by Actipro CodeHighlighter (freeware)<br />http://www.CodeHighlighter.com/<br /><br />--> < SPAN style = "COLOR: #0000ff" >new</ SPAN >< SPAN style = "COLOR: #000000" > Chart(width: </ SPAN >< SPAN style = "COLOR: #800080" >600</ SPAN >< SPAN style = "COLOR: #000000" >, height: </ SPAN >< SPAN style = "COLOR: #800080" >400</ SPAN >< SPAN style = "COLOR: #000000" >< BR > , theme: ChartTheme.Green < BR > ,themePath:</ SPAN >< SPAN style = "COLOR: #0000ff" >null</ SPAN >< SPAN style = "COLOR: #000000" >< BR > )</ SPAN ></ DIV ></ PRE > </ DIV >< P > </ P > |
2添加标题
public Chart AddTitle(string text = null, 添加标题
string name = null
//设置唯一标示 System.Web.UI.DataVisualization.Charting.Title object.
);
< DIV class = cnblogs_code >< PRE >< DIV > <!--<br /><br />Code highlighting produced by Actipro CodeHighlighter (freeware)<br />http://www.CodeHighlighter.com/<br /><br />--> < SPAN style = "COLOR: #000000" > .AddTitle(text:</ SPAN >< SPAN style = "COLOR: #800000" >"</ SPAN >< SPAN style = "COLOR: #800000" >chat title</ SPAN >< SPAN style = "COLOR: #800000" >"</ SPAN >< SPAN style = "COLOR: #000000" >,name:</ SPAN >< SPAN style = "COLOR: #800000" >"</ SPAN >< SPAN style = "COLOR: #800000" >chat1</ SPAN >< SPAN style = "COLOR: #800000" >"</ SPAN >< SPAN style = "COLOR: #000000" >)</ SPAN ></ DIV ></ PRE > </ DIV >< P >< SPAN style = "FONT-FAMILY: verdana, 'courier new'; WHITE-SPACE: normal" class = Apple -style-span> </ SPAN ></ P > |
3添加数据源
public Chart AddSeries(string name = null,string chartType = "Column",
//System.Web.UI.DataVisualization.Charting.SeriesChartType 下的枚举值
string chartArea = null,
//获取或设置用于绘制数据系列的 ChartArea 对象(如果有)的名称。
string axisLabel = null, 获取或设置系列的轴标签文本。
string legend = null, 获取或设置与 Legend 对象关联的系列的名称。
int markerStep = 1, //获取或设置用于决定数据点标记的显示频率的值。
IEnumerable xValue = null, x轴的数据源
string xField = null, x轴的数据绑定的字段。
IEnumerable yValues = null, Y轴的数据源
string yFields = null Y轴的数据绑定的字段。
);
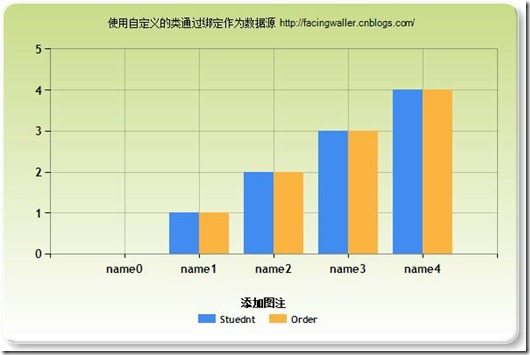
< DIV class = cnblogs_code >< PRE >< DIV > <!--<br /><br />Code highlighting produced by Actipro CodeHighlighter (freeware)<br />http://www.CodeHighlighter.com/<br /><br />--> < SPAN style = "COLOR: #000000" >.AddSeries(< BR > name: </ SPAN >< SPAN style = "COLOR: #800000" >"</ SPAN >< SPAN style = "COLOR: #800000" >Stuednt</ SPAN >< SPAN style = "COLOR: #800000" >"</ SPAN >< SPAN style = "COLOR: #000000" >< BR > , xValue: </ SPAN >< SPAN style = "COLOR: #0000ff" >new</ SPAN >< SPAN style = "COLOR: #000000" >[] { </SPAN >< SPAN style = "COLOR: #800000" >"</ SPAN >< SPAN style = "COLOR: #800000" >Peter</ SPAN >< SPAN style = "COLOR: #800000" >"</ SPAN >< SPAN style = "COLOR: #000000" >, </ SPAN >< SPAN style = "COLOR: #800000" >"</ SPAN >< SPAN style = "COLOR: #800000" >Andrew</ SPAN >< SPAN style = "COLOR: #800000" >"</ SPAN >< SPAN style = "COLOR: #000000" >, </ SPAN >< SPAN style = "COLOR: #800000" >"</ SPAN >< SPAN style = "COLOR: #800000" >Julie</ SPAN >< SPAN style = "COLOR: #800000" >"</ SPAN >< SPAN style = "COLOR: #000000" >, </ SPAN >< SPAN style = "COLOR: #800000" >"</ SPAN >< SPAN style = "COLOR: #800000" >Mary</ SPAN >< SPAN style = "COLOR: #800000" >"</ SPAN >< SPAN style = "COLOR: #000000" >, </ SPAN >< SPAN style = "COLOR: #800000" >"</ SPAN >< SPAN style = "COLOR: #800000" >张1</ SPAN >< SPAN style = "COLOR: #800000" >"</ SPAN >< SPAN style = "COLOR: #000000" > }< BR > ,yValues: </ SPAN >< SPAN style = "COLOR: #0000ff" >new</ SPAN >< SPAN style = "COLOR: #000000" >[] { </SPAN >< SPAN style = "COLOR: #800000" >"</ SPAN >< SPAN style = "COLOR: #800000" >2</ SPAN >< SPAN style = "COLOR: #800000" >"</ SPAN >< SPAN style = "COLOR: #000000" >, </ SPAN >< SPAN style = "COLOR: #800000" >"</ SPAN >< SPAN style = "COLOR: #800000" >6</ SPAN >< SPAN style = "COLOR: #800000" >"</ SPAN >< SPAN style = "COLOR: #000000" >, </ SPAN >< SPAN style = "COLOR: #800000" >"</ SPAN >< SPAN style = "COLOR: #800000" >4</ SPAN >< SPAN style = "COLOR: #800000" >"</ SPAN >< SPAN style = "COLOR: #000000" >, </ SPAN >< SPAN style = "COLOR: #800000" >"</ SPAN >< SPAN style = "COLOR: #800000" >5</ SPAN >< SPAN style = "COLOR: #800000" >"</ SPAN >< SPAN style = "COLOR: #000000" >, </ SPAN >< SPAN style = "COLOR: #800000" >"</ SPAN >< SPAN style = "COLOR: #800000" >3</ SPAN >< SPAN style = "COLOR: #800000" >"</ SPAN >< SPAN style = "COLOR: #000000" > }< BR > , chartType: type.ToString() < BR > , axisLabel: </ SPAN >< SPAN style = "COLOR: #800000" >"</ SPAN >< SPAN style = "COLOR: #800000" >获取或设置系列的轴标签文本</ SPAN >< SPAN style = "COLOR: #800000" >"</ SPAN >< SPAN style = "COLOR: #000000" >< BR > , legend: xVal[</ SPAN >< SPAN style = "COLOR: #800080" >3</ SPAN >< SPAN style = "COLOR: #000000" >]< BR > , markerStep :</ SPAN >< SPAN style = "COLOR: #800080" >3</ SPAN >< SPAN style = "COLOR: #000000" > < BR > < BR > )</ SPAN ></ DIV ></ PRE > </ DIV >< P >< BR ></ P > |

3.1反复调用AddSeries可以添加多个
3.2重复绑定
如果同时指定 yValues 和yFields ,会同时显示同时指定 xValues 和xFields ,xFields优先。

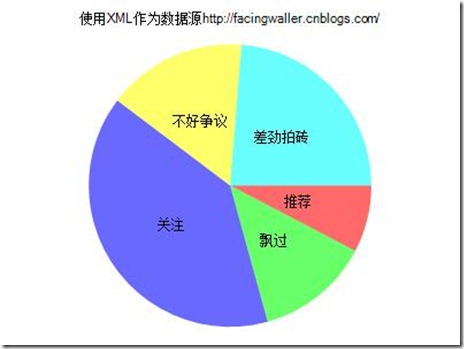
3.3使用xml作为数据源
@using System.Data;@{var dataSet = new DataSet();
dataSet.ReadXmlSchema(Server.MapPath("/App_Data/data.xsd"));
dataSet.ReadXml(Server.MapPath("/App_Data/data.xml"));
var dataView = new DataView(dataSet.Tables[0]);
new Chart(width: 400, height: 300
, theme: ChartTheme.Vanilla
)
.AddSeries("Default", chartType: "Pie",
xValue: dataView, xField: "Name",
yValues: dataView, yFields: "Sales")
.Write();
}

4数据绑定
public Chart DataBindTable(IEnumerable dataSource, 数据源string xField = null ,x轴字段
);
< DIV class = cnblogs_code >< PRE >< DIV > <!--<br /><br />Code highlighting produced by Actipro CodeHighlighter (freeware)<br />http://www.CodeHighlighter.com/<br /><br />--> < SPAN style = "COLOR: #000000" >List</ SPAN >< SPAN style = "COLOR: #000000" ><</ SPAN >< SPAN style = "COLOR: #000000" >CMS5_Razor.Models.Test</ SPAN >< SPAN style = "COLOR: #000000" >></ SPAN >< SPAN style = "COLOR: #000000" > list </ SPAN >< SPAN style = "COLOR: #000000" >=</ SPAN >< SPAN style = "COLOR: #000000" > </ SPAN >< SPAN style = "COLOR: #0000ff" >new</ SPAN >< SPAN style = "COLOR: #000000" > List</ SPAN >< SPAN style = "COLOR: #000000" ><</ SPAN >< SPAN style = "COLOR: #000000" >CMS5_Razor.Models.Test</ SPAN >< SPAN style = "COLOR: #000000" >></ SPAN >< SPAN style = "COLOR: #000000" >();< BR > </ SPAN >< SPAN style = "COLOR: #0000ff" >for</ SPAN >< SPAN style = "COLOR: #000000" > (</ SPAN >< SPAN style = "COLOR: #0000ff" >int</ SPAN >< SPAN style = "COLOR: #000000" > i </ SPAN >< SPAN style = "COLOR: #000000" >=</ SPAN >< SPAN style = "COLOR: #000000" > </ SPAN >< SPAN style = "COLOR: #800080" >0</ SPAN >< SPAN style = "COLOR: #000000" >; i </ SPAN >< SPAN style = "COLOR: #000000" ><</ SPAN >< SPAN style = "COLOR: #000000" > </ SPAN >< SPAN style = "COLOR: #800080" >5</ SPAN >< SPAN style = "COLOR: #000000" >; i</ SPAN >< SPAN style = "COLOR: #000000" >++</ SPAN >< SPAN style = "COLOR: #000000" >) {<BR > list.Add(</ SPAN >< SPAN style = "COLOR: #0000ff" >new</ SPAN >< SPAN style = "COLOR: #000000" > CMS5_Razor.Models.Test() { Name </SPAN >< SPAN style = "COLOR: #000000" >=</ SPAN >< SPAN style = "COLOR: #000000" > </ SPAN >< SPAN style = "COLOR: #800000" >"</ SPAN >< SPAN style = "COLOR: #800000" >name</ SPAN >< SPAN style = "COLOR: #800000" >"</ SPAN >< SPAN style = "COLOR: #000000" > </ SPAN >< SPAN style = "COLOR: #000000" >+</ SPAN >< SPAN style = "COLOR: #000000" > i, Order </ SPAN >< SPAN style = "COLOR: #000000" >=</ SPAN >< SPAN style = "COLOR: #000000" > i, Content </ SPAN >< SPAN style = "COLOR: #000000" >=</ SPAN >< SPAN style = "COLOR: #000000" > </ SPAN >< SPAN style = "COLOR: #800000" >"</ SPAN >< SPAN style = "COLOR: #800000" >Content</ SPAN >< SPAN style = "COLOR: #800000" >"</ SPAN >< SPAN style = "COLOR: #000000" >+</ SPAN >< SPAN style = "COLOR: #000000" >i });< BR > }< BR >< BR ></ SPAN >< SPAN style = "COLOR: #000000" >//----------------------------</ SPAN >< SPAN style = "COLOR: #000000" >< BR >< BR >< BR >.DataBindTable(list, xField: </ SPAN >< SPAN style = "COLOR: #800000" >"</ SPAN >< SPAN style = "COLOR: #800000" >Name</ SPAN >< SPAN style = "COLOR: #800000" >"</ SPAN >< SPAN style = "COLOR: #000000" >)</ SPAN ></ DIV ></ PRE > </ DIV > |
5添加图注
.AddLegend(title:"添加图注")6保存数据
string xmlPath = "savedchart.xml";chart.SaveXml(xmlPath);
7图表与缓存
1保存图表到缓存
public string SaveToCache(string key = null,int minutesToCache = 20,缓存时间,分钟为单位
bool slidingExpiration = true 是否平滑显示
);
2从缓存中读出
Chart.GetFromCache( string key = null );@{
//保存到缓存
var mychart = Chart.GetFromCache("mychartkey");
if (mychart != null) {
mychart.AddTitle("从缓存中读出"+DateTime.Now);
mychart.Write();
} else {
mychart = new Chart(width: 600, height: 400)
.AddTitle("保存进缓存"+DateTime.Now)
.AddSeries(
name: "Employee",
xValue: new[] { "Peter", "Andrew", "Julie", "Mary", "Dave" },
yValues: new[] { "2", "6", "4", "5", "3" })
.Write() ;
mychart.SaveToCache(key: "mychartkey", minutesToCache: 11, slidingExpiration: false);
}
}

8保存到文件
@{//保存到文件
var mychart = new Chart(width: 400, height: 300)
.AddTitle("保存到文件再从文件中读取")
.AddSeries(
name: "Employee",
xValue: new[] { "Peter", "Andrew", "Julie", "Mary", "Dave" },
yValues: new[] { "2", "6", "4", "5", "3" });
var path = "~/Content/Image/mychart.jpg";
var imgpath = Server.MapPath(path);
mychart.Save(path: imgpath, format: "jpeg");
}
<img src="@Href(path)" />

9其他
1 更多图表的样式| 成员名称 | 说明 | |
| Point | 点图类型。 | |
| FastPoint | 快速点图类型。 | |
| Bubble | 气泡图类型。 | |
| Line | 折线图类型。 | |
| Spline | 样条图类型。 | |
| StepLine | 阶梯线图类型。 | |
| FastLine | 快速扫描线图类型。 | |
| Bar | 条形图类型。 | |
| StackedBar | 堆积条形图类型。 | |
| StackedBar100 | 百分比堆积条形图类型。 | |
| Column | 柱形图类型。 | |
| StackedColumn | 堆积柱形图类型。 | |
| StackedColumn100 | 百分比堆积柱形图类型。 | |
| Area | 面积图类型。 | |
| SplineArea | 样条面积图类型。 | |
| StackedArea | 堆积面积图类型。 | |
| StackedArea100 | 百分比堆积面积图类型。 | |
| Pie | 饼图类型。 | |
| Doughnut | 圆环图类型。 | |
| Stock | 股价图类型。 | |
| Candlestick | K 线图类型。 | |
| Range | 范围图类型。 | |
| SplineRange | 样条范围图类型。 | |
| RangeBar | 范围条形图类型。 | |
| RangeColumn | 范围柱形图类型。 | |
| Radar | 雷达图类型。 | |
| Polar | 极坐标图类型。 | |
| ErrorBar | 误差条形图类型。 | |
| BoxPlot | 盒须图类型。 | |
| Renko | 砖形图类型。 | |
| ThreeLineBreak | 新三值图类型。 | |
| Kagi | 卡吉图类型。 | |
| PointAndFigure | 点数图类型。 | |
| Funnel | 漏斗图类型。 | |
| Pyramid | 棱锥图类型。 |
2参考
Series 成员
http://msdn.microsoft.com/zh-cn/library/system.web.ui.datavisualization.charting.series_members.aspx
3源码下载
http://files.cnblogs.com/facingwaller/learn2UseRazor3.rar
之前的是
http://files.cnblogs.com/facingwaller/learn2UseRazor1-2.rar
4尚未完成的问题
1 themePath的使用。2 各种图表的具体使用,有些能兼容。
3 来自同学的提醒,似乎还不能精确控制。 在到处的xml中似乎可以比较精确的控制,
但是由于时间问题,不做深入探究。欢迎大家交流。

相关文章推荐
- MVC3-RAZOR尝鲜之漂亮的chart图表
- MVC3-RAZOR尝鲜之漂亮的chart图表
- MVC-Chart_WebGrid 显示漂亮chart
- MVC3-RAZOR尝鲜1
- Essential Chart for ASP.NET MVC商业图表控件相关介绍及下载
- 利用MVC Chart 打造后台图表、前端图表(转)
- ASP.NET MVC 3 Beta: Built-in support for charts(MVC3 Razor中使用图表的最佳方案)
- WPF入门:用 Modern UI + Metro Chart 打造漂亮的图表(1)
- ASP.NET MVC 3 Beta: Built-in support for charts(MVC3 Razor中使用图表的最佳方案)
- ChartSQL —— 用 SQL 语句来生成图形图表(既简单又漂亮)
- ASP.NET MVC 3 Beta: Built-in support for charts(MVC3 Razor中使用图表的最佳方案)
- 用 chart.js 创建漂亮图表 (HTML绘制工具库)
- ASP.NET MVC 3 Beta: Built-in support for charts(MVC3 Razor中使用图表的最佳方案)
- ASP.NET MVC 3 Beta: Built-in support for charts(MVC3 Razor中使用图表的最佳方案)
- web开发经验—MVC 图表Chart
- ASP.NET MVC 3 Beta: Built-in support for charts(MVC3 Razor中使用图表的最佳方案)
- 使用Chart.js图表库制作漂亮的响应式表单
- 图表(APAndroidChart)
- 安卓图表hellochart - 饼状图PieChartView(三)
- GEOSERVER显示图表(CHART)