【gloomyfish】数据分析之 – 离群值(Outliers) BoxPlot
2011-05-01 21:46
316 查看
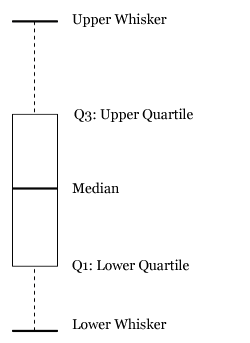
数据分析之 – 离群值(Outliers) 一:什么是Outliers Outliers是统计学专业术语,是指相比一组数据中的其它数据的极限值 二:极限值意味什么 1. 决定哪些值是Outliers是一个主观行为,有一些基准数据来决定是否一个值是一个Outliers,这些基准是任意选择的,比如P<=0.5就是一个任意选择的基准 2. 一个基准是用BoxPlot来决定适度离群值(mild Outliers)和极限离群值(extreme Outliers),适度离群值是任何值1.5倍大于基于剩下所有的值的IQR,极限离群值是任何值3倍大于剩下所有的值的IQR,IQR(Interquartile Range)代表四分位数间距,是这些值中的50%中间值,分别是Q1-25%, Median-50%,Q3-75%, IQR=Q3-Q1 三:使用Box Plot来发现Outliers 一个典型的Box Plot是基于以下五个值计算而来的 a. 一组样本的最小值 b. 一组样本的最大值 c. 一组样本的中值 d. 下四分位数(Lower Quartile / Q1) e. 上四分位数(Upper Quartile / Q3) 根据这五个值构建出来基本的Box Plot,某些图形软件还会显示平均值,IQR= Q3 – Q1 显然超出上下四分位数的值可以看做为Outliers。我们通过眼睛就可以很好的观察到这些Outliers值的点。
一个显示适度和极限Outliers值的Box plot显示如下:
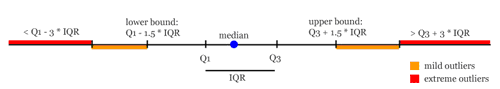
四:示例说明及JfreeChart的实现 假设一组数据为:2,4,6,8,12,14,16,18,20,25,45 中值 Median = 14 Q1-下四分位数(11 * 0.25 = 3) = 7 Q3-上四分位数(11 * 0.75 = 9) =19 IQR(Q3 – Q1) = 12 1.5 * IQR = 18 最小值(6 – 1.5 * IQR)= 2 最大值(20 + 1.5 * IQR)= 25 很显然值45是一个适度Outliers 对比的一组数据为:2,4,6,8,12,14,16,18,20,25,26

从图上可以看出Series0的数据存在Outliers,一个红色三角形已经表明 同样Series1的数据是一组非常好的数据,没有Outliers. 下面是Java源代码:
一个显示适度和极限Outliers值的Box plot显示如下:
四:示例说明及JfreeChart的实现 假设一组数据为:2,4,6,8,12,14,16,18,20,25,45 中值 Median = 14 Q1-下四分位数(11 * 0.25 = 3) = 7 Q3-上四分位数(11 * 0.75 = 9) =19 IQR(Q3 – Q1) = 12 1.5 * IQR = 18 最小值(6 – 1.5 * IQR)= 2 最大值(20 + 1.5 * IQR)= 25 很显然值45是一个适度Outliers 对比的一组数据为:2,4,6,8,12,14,16,18,20,25,26
从图上可以看出Series0的数据存在Outliers,一个红色三角形已经表明 同样Series1的数据是一组非常好的数据,没有Outliers. 下面是Java源代码:
package com.dataanalysis.plots; import java.awt.Font; import java.util.ArrayList; import java.util.List; import org.jfree.chart.ChartPanel; import org.jfree.chart.JFreeChart; import org.jfree.chart.axis.CategoryAxis; import org.jfree.chart.axis.NumberAxis; import org.jfree.chart.labels.BoxAndWhiskerToolTipGenerator; import org.jfree.chart.plot.CategoryPlot; import org.jfree.chart.renderer.category.BoxAndWhiskerRenderer; import org.jfree.data.statistics.BoxAndWhiskerCategoryDataset; import org.jfree.data.statistics.DefaultBoxAndWhiskerCategoryDataset; import org.jfree.ui.ApplicationFrame; import org.jfree.ui.RefineryUtilities; public class BoxAndWhiskerDemo extends ApplicationFrame { /** * */ private static final long serialVersionUID = -3205574763811416266L; /** * Creates a new demo. * * @param title the frame title. */ public BoxAndWhiskerDemo(final String title) { super(title); final BoxAndWhiskerCategoryDataset dataset = createSampleDataset(); final CategoryAxis xAxis = new CategoryAxis("Type"); final NumberAxis yAxis = new NumberAxis("Value"); yAxis.setAutoRangeIncludesZero(false); final BoxAndWhiskerRenderer renderer = new BoxAndWhiskerRenderer(); renderer.setFillBox(false); renderer.setToolTipGenerator(new BoxAndWhiskerToolTipGenerator()); final CategoryPlot plot = new CategoryPlot(dataset, xAxis, yAxis, renderer); final JFreeChart chart = new JFreeChart( "Box-and-Whisker Demo", new Font("SansSerif", Font.BOLD, 14), plot, true ); final ChartPanel chartPanel = new ChartPanel(chart); chartPanel.setPreferredSize(new java.awt.Dimension(450, 270)); setContentPane(chartPanel); } /** * Creates a sample dataset. * * @return A sample dataset. */ private BoxAndWhiskerCategoryDataset createSampleDataset() { final int seriesCount = 2; final int categoryCount = 4; double[] data = null; final DefaultBoxAndWhiskerCategoryDataset dataset = new DefaultBoxAndWhiskerCategoryDataset(); for (int i = 0; i < seriesCount; i++) { if(i == 0) { data = new double[]{2,4,6,8,12,14,16,18,20,25,45}; } else { data = new double[]{2,4,6,8,12,14,16,18,20,25,26}; } for (int j = 0; j < categoryCount; j++) { final List list = new ArrayList(); for (int k = 0; k < data.length; k++) { list.add(new Double(data[k])); } dataset.add(list, "Series " + i, " Type " + j); } } return dataset; } /** * For testing from the command line. * * @param args ignored. */ public static void main(final String[] args) { final BoxAndWhiskerDemo demo = new BoxAndWhiskerDemo("Box-and-Whisker Chart Demo"); demo.pack(); RefineryUtilities.centerFrameOnScreen(demo); demo.setVisible(true); } }

相关文章推荐
- 【gloomyfish】数据分析之 – 离群值(Outliers) BoxPlot
- 【gloomyfish】数据分析之 – 离群值(Outliers) BoxPlot
- 【gloomyfish】【原创】数据分析之 – 散点图
- 【gloomyfish】【原创】数据分析之 – 散点图
- 【gloomyfish】【原创】数据分析之 – 散点图
- 网站用户行为数据收集和分析方法
- 数据分析遐想
- distcp导致个别datanode节点数据存储严重不均衡分析
- Python数据分析工具包:Pandas
- 大数据分析:结合 Hadoop或 Elastic MapReduce使用 Hunk
- Python数据分析入门
- [大数据]使用hive做数据分析
- Python数据分析与机器学习-scikit-learn模型建立与评估
- 分析一段H264视频数据
- EMC颜开分析Dremel原理,如何在3秒内分析1PB数据
- Python金融应用编程(数据分析、定价与量化投资)
- [置顶] python 数据分析 高效的学习路径
- 数据分析复盘——基础之SQL语句
- 社交网站的数据挖掘与分析(Mining the Social Web)
- libev源代码分析--数据结构