月份信息二维坐标图绘制(全部是随机数据,包括计算的月份数,附源代码)
2011-01-03 15:45
537 查看
(一)序
继GC垃圾收集器模拟后,在这段时间境界有所突破,特别是编码风格以及代码质量有所提高,还有就是对程序的整体把握能力有了新的突破。至于突破的原因,归根于某位大虾******(哥被鄙视了N回,哈哈)。通过比较并且分析这位大虾与自己的代码的差距,本人学到了很多东西。有些东西只能意会,反而表达不出来。
以下的内容,本人昨天从早上一直写到晚上,主要是针对如何绘制月信息图(全部是随机的,包括月份数,单位大小等等,这些都是可以设置的,你仅仅需要传递一个需要转换的数据以及几个参数就可以了。连数据是间隔的也可以。)。 这个是可以脱离于Winform的,因为本人已经将其分离出来了。还有一点需要说明:本人对Winform不太熟悉,只是拿来显示下界面效果而已,界面比较粗糙。当然,由于时间有限,不可避免会有N多BUG,还请各位牛人多多指点。
(二)初步了解
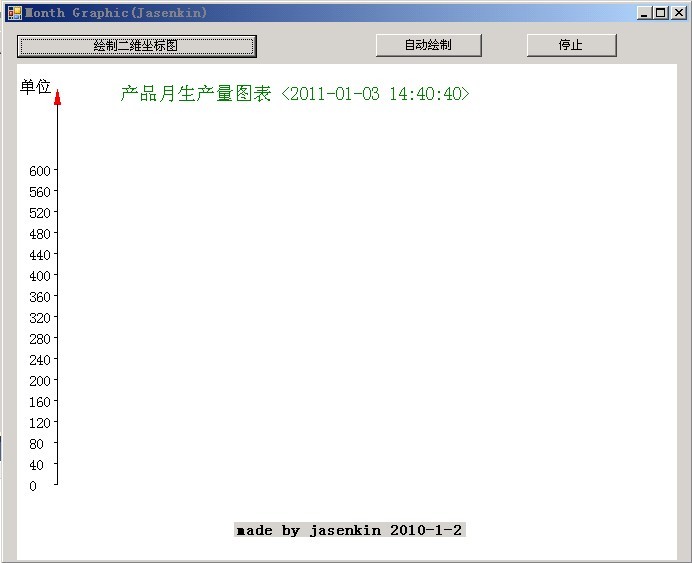
先看下如下的界面图,对整个东西有一个初步的了解。
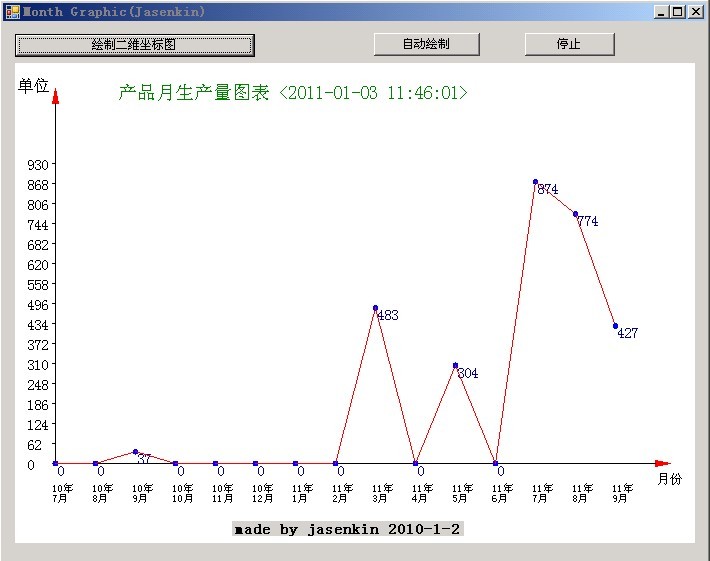
随机图一(设置高600,宽800,月份数随机,值随机):
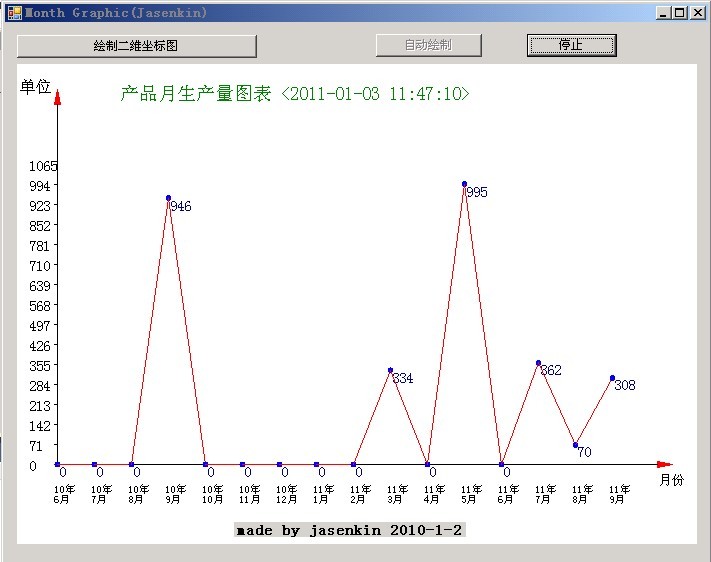
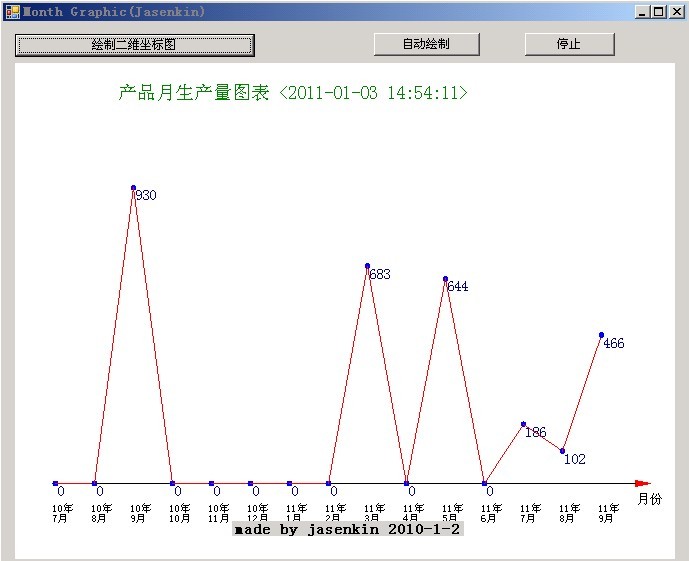
随机图二(设置高600,宽800,月份数随机,值随机):
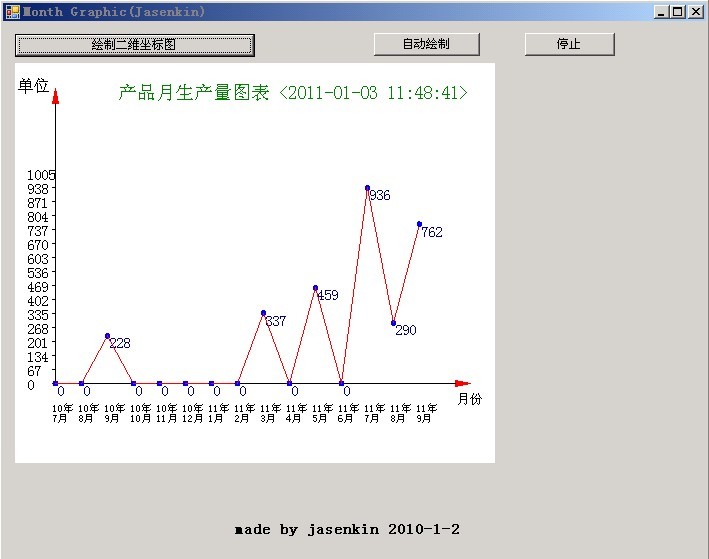
随机图三(设置高400,宽480,月份数随机,值随机):
通过对上面3张图片的比较与分析,你应该已经发现了如下规则:
(1)月份数目是随机的,月份标题也会根据数目的不同而随机变化。
(2)显示内容的宽度和高度是可以控制的。
(3)Y轴内容(值)也会根据传入的数据来自动设置相应的Y轴值。同样,X轴的标题也会根据需要显示的月份数而进行自动设置。
(4)月度数据是随机的,显示正常。
等等,还有其他的,这里就不再多说了,具体内容还得看代码。
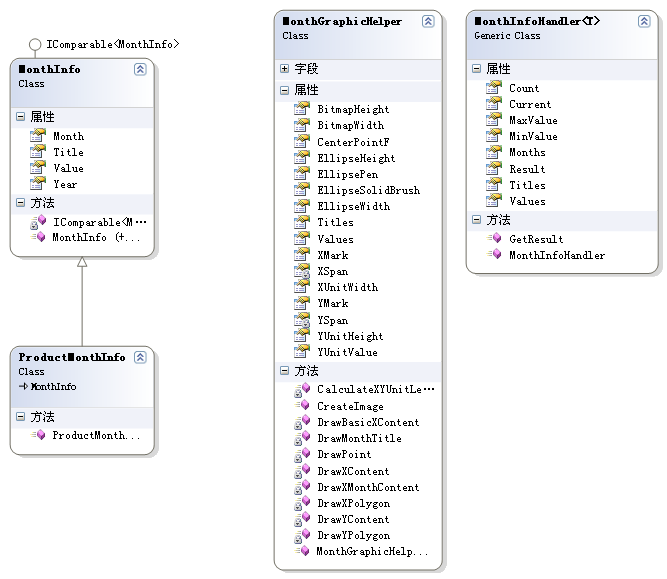
(三)对项目所有文件布局的整体把握
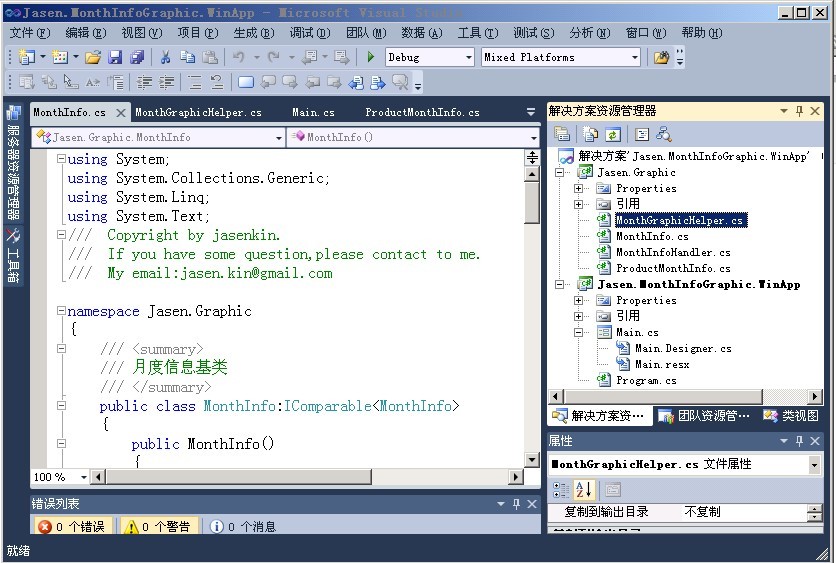
MonthInfo.cs:月份信息基类。
MonthInfoHandler.cs:月份信息处理类。对传入的数据进行处理,返回相关数据的属性特征值以及经过处理后的结果集合。
MonthGraphicHelper.cs:图形绘制处理类。对传入的数据进行处理,绘制与数据相对应的二维坐标。
ProductMonthInfo.cs:为MonthInfo的子类,主要是为了充分利用MonthInfo的所有功能。你可以通过继承MonthInfo来利用以上的所有功能。
看一下我们的类图,你能够从整体上把握类的功能,如下:
(四)详细讲解以上文件的内容以及作用
(1)MonthInfo类为月份信息类。其中实现IComparable<T>接口主要是为了实现List<T>.Sort()排序,使数据能够相互比较,并且按照年份、月份来进行排序。
1 public class MonthInfo:IComparable<MonthInfo>
2 {
3 //中间其他的省略.............
#region IComparable<MonthInfo> 成员
59
60 int IComparable<MonthInfo>.CompareTo(MonthInfo other)
61 {
62 if (other == null)
63 {
64 return -1;
65 }
66
67 if (this.Year != other.Year)
68 {
69 return decimal.Compare(this.Year,other.Year);
70 }
71
72 return decimal.Compare(this.Month,other.Month);
73 }
74
75 #endregion
76 }
(2)MonthInfoHandler<T>类主要是处理MonthInfo的子类集合(T : MonthInfo,new ())。通过 public MonthInfoHandler(List<T> list,int count)构造函数来设置需要处理的集合数据以及数据中最大的年份月份往前推的月份数(比如传入的数据最大的年份月份为2011-10,那么从最大的年份月份往前推10个月,那么就需要计算到2011-1月的数据)。主要的算法都集中在GetResult()方法中。
先看如下的代码,然后再讲解算法。
1 public class MonthInfoHandler<T> where T : MonthInfo,new ()
2 {
12 public MonthInfoHandler(List<T> list,int count)
58 {
59 this.Current = list;
60 this.Count = count;
61 }
62
89 public byte[] Months
90 {
91 get
92 {
93 return (from e in this.Result
94 where !string.IsNullOrEmpty(e.Title)
95 select e.Month).ToArray<byte>();
96 }
97 }
98
99 /// <summary>
100 /// 获取月度信息结果集合
101 /// </summary>
102 /// <returns></returns>
103 public List<MonthInfo> GetResult()
104 {
105 if(this.Current==null||this.Current.Count==0)
106 {
107 return null;
108 }
109
110 this.Result = new List<MonthInfo>();
111 this.Current.Sort();
112 T lastInfo = this.Current.Last();
113
114 short year = lastInfo.Year;
115 byte month = lastInfo.Month;
116 for (int index = 0; index < this.Count; index++)
117 {
118 this.Result.Add(new MonthInfo(year,month));
119 month--;
120 if(month==0)
121 {
122 year--;
123 month = 12;
124 }
125 }
126
127 foreach(var item in this.Current)
128 {
129 int index=this.Result.FindIndex(p => p.Year == item.Year && p.Month ==item.Month);
130 if (index >= 0)
131 {
132 this.Result[index].Value = item.Value;
133 }
134 }
135
136 this.Result.Sort();
137 return this.Result;
138 }
139 }
算法111-115行先对传入的数据进行排序,使数据为递增的形式呈现。然后获取最后的一个对象,因而获取最大的年份、月份数值。你肯定想问:为什么这么做?这是因为传入的数据有时候是杂乱的、没有顺序的。这里仅仅是为了获取最大的年份、月份值而已。
116-125:设置Result数据。通过最大的年份与月份往前推N个月,因此Result数据也应该有N个对象。当月份等于0时候,年份减1,月份设置为12。这个是常识,哈哈。
127-134:遍历传入的数据集合,通过List<T>.FindIndex();来获取与item年份、月份相等的第一个对象(Result集合中的某个对象)的索引(单链表起始索引为0)。如果存在,将item的值赋给Result中对应的对象。
136:将Result中的数据进行排序(反转也可以)。到这一步,我们的数据已经处理好了,年份、月份的数据都是连续的,并且是排序过的。
其中,处理结果的各种相关数据,比如Values ,Titiles , Months等等都是可以获取的。
(3)MonthGraphicHelper.cs类,图像绘制类,主要负责对传入数据的分析和绘制。
构造函数设置图的宽度和高度,以及X,Y的标识,中心点(二维坐标的原点)
1 public MonthGraphicHelper(int width,int height,string xMark,string yMark)
2 {
3 this.YMark = xMark??"单位";
4 this.XMark = yMark??"月份";
5 this.BitmapWidth = width > 0 ? width : 800;
6 this.BitmapHeight = height > 0 ? height : 600;
7 this.CenterPointF = new PointF(this.YSpan, this.BitmapHeight - this.YSpan * 2);
8 }
主要绘制过程如下:
10 public Bitmap CreateImage(string[] titles, float[] values, float maxValue, float minValue, string title)
11 {
12 int count = titles.Length;
13 this.Titles = titles;
14 this.Values = values;
15
16 Bitmap bitmap = new Bitmap(this.BitmapWidth, this.BitmapHeight);
17 Graphics graphics = Graphics.FromImage(bitmap);
18 graphics.Clear(Color.White);
19
20 //绘制图表标题
21 title += " <"+DateTime.Now.ToString("yyyy-MM-dd HH:mm:ss")+">";
22 graphics.DrawString(title,
23 new Font("宋体", 14),
24 Brushes.Green,
25 new PointF(this.CenterPointF.X + 60,20));
26
27 //计算X,Y单位长度
28 CalculateXYUnitLength(maxValue, minValue, count);
29
30 //绘制Y轴内容
31 DrawYContent(count, graphics);
32
33 //绘制X轴内容
34 DrawXContent(count, graphics);
35
36 return bitmap;
37 }
其中这里又可以分为如下几个步骤:
(3A)绘制图标标题,略。
(3B)计算X,Y单位长度。通过传入的月份数据最大值和最小值,以及设置的YCount数目,计算出Y单位高度以及Y单位值。通过传入的月份个数,计算出X的单位长度。
1 private void CalculateXYUnitLength(float maxValue, float minValue, int count)
2 {
3 float yMaxValue = maxValue - minValue;
4 float yLength = this.CenterPointF.Y - this.YSpan * 3;
5
6 if (YCount > 1)
7 {
8 YUnitHeight = (float)Math.Round((double)yLength / (YCount - 1), 0);
9 YUnitValue = (float)Math.Round((double)yMaxValue / (YCount - 1), 0);
10 }
11
12 if (count > 1)
13 {
14 float xLength = this.BitmapWidth - this.CenterPointF.X - this.XSpan * 2;
15 XUnitWidth = (float)Math.Round((double)xLength / (count - 1), 0);
16 }
17 }
(3C)绘制Y轴内容,以下都是做了注释的,不再做重复说明。
6 private void DrawYContent(int count, Graphics graphics)
7 {
8 //绘制Y箭头
9 DrawYPolygon(graphics);
10
11 //画y轴线
12 graphics.DrawLine(Pens.Black,
13 this.CenterPointF.X,
14 this.CenterPointF.Y,
15 this.CenterPointF.X,
16 this.YSpan);
17
18 graphics.DrawString(this.YMark, new Font("宋体", 12),
19 Brushes.Black, new PointF(0, this.YSpan - 25));
20
21 //绘制Y轴数据
22 for (int index = 0; index <= YCount; index++)
23 {
24 graphics.DrawString((index * YUnitValue).ToString(),
25 new Font("宋体", 11),
26 Brushes.Black,
27 new PointF(this.CenterPointF.X - 30,
28 this.CenterPointF.Y - index * YUnitHeight - 6));
29 graphics.DrawLine(Pens.Black,
30 this.CenterPointF.X - 3,
31 this.CenterPointF.Y - index * YUnitHeight,
32 this.CenterPointF.X,
33 this.CenterPointF.Y - index * YUnitHeight);
34 }
35 }
绘制后的效果如下所示:
(3D)绘制X轴内容
1 private void DrawXContent(int count, Graphics graphics)
2 {
3 //绘制X箭头
4 DrawXPolygon(graphics);
5
6 DrawBasicXContent(graphics);
7
8 DrawXMonthContent(count, graphics);
9 }
看下箭头是如何绘制的,代码如下:
1 private void DrawXPolygon(Graphics graphics)
2 {
3 PointF[] polygonXPoints ={
4 new PointF(this.BitmapWidth-this.XSpan + 15, this.CenterPointF.Y),
5 new PointF(this.BitmapWidth-this.XSpan, this.CenterPointF.Y - 3),
6 new PointF(this.BitmapWidth-this.XSpan, this.CenterPointF.Y + 3) };
7
8 graphics.DrawPolygon(Pens.Red, polygonXPoints);
9 graphics.FillPolygon(new SolidBrush(Color.Red), polygonXPoints);
10 }
这里主要是通过绘制多边形来绘制箭头。发散思维考虑下:如何在二维坐标中绘制任意方向的箭头?这个需要对坐标点进行设置,可以通过对X轴、Y轴以及4个方向进行三角函数的算法设置,这个将在以后的文章中再进行考虑,本文不再考虑该箭头算法。
绘制X轴月份内容代码如下:
1 private void DrawXMonthContent(int count, Graphics graphics)
2 {
3 for (int index = 0; index < count; index++)
4 {
5 //画x轴月份标题
6 DrawMonthTitle(graphics, index);
7
8 //画点
9 DrawPoint(graphics, index);
10
11 //画数值
12 graphics.DrawString(Values[index].ToString(),
13 new Font("宋体", 11),
14 Brushes.DarkBlue,
15 new PointF(this.CenterPointF.X + (index) * this.XUnitWidth,
16 this.CenterPointF.Y - Values[index] / this.YUnitValue * this.YUnitHeight));
17
18 //画折线
19 if (index < count - 1)
20 {
21 graphics.DrawLine(Pens.Red,
22 this.CenterPointF.X + (index) * this.XUnitWidth,
23 this.CenterPointF.Y - Values[index] / this.YUnitValue * this.YUnitHeight,
24 this.CenterPointF.X + (index+1) * this.XUnitWidth,
25 this.CenterPointF.Y - Values[index + 1] / this.YUnitValue * this.YUnitHeight);
26 }
27 }
28 }
我们把Y轴的绘制注释掉,看下X轴绘制了什么,图形如下:
(五)客户端如何使用
总体的已经介绍完了,那客户端如何使用以上的内容?这就是这个步骤将要讲解的,这也是大家最关注的。先看如下代码:
1 private void btnCreate_Click(object sender, EventArgs e)
2 {
3 DrawingImage();
4 }
5
6 private void DrawingImage()
7 {
8 List<ProductMonthInfo> infos = new List<ProductMonthInfo>();
9 Random random = new Random();
10 infos.Add(new ProductMonthInfo(2010, 9, random.Next(10, 1000)));
11 infos.Add(new ProductMonthInfo(2011, 8, random.Next(10, 1000)));
12 infos.Add(new ProductMonthInfo(2011, 3, random.Next(10, 1000)));
13 infos.Add(new ProductMonthInfo(2011, 5, random.Next(10, 1000)));
14 infos.Add(new ProductMonthInfo(2011, 7, random.Next(10, 1000)));
15 infos.Add(new ProductMonthInfo(2011, 9, random.Next(10, 1000)));
16
17
18 MonthInfoHandler<ProductMonthInfo> handler =
19 new MonthInfoHandler<ProductMonthInfo>(infos, random.Next(10, 20));
20 List<MonthInfo> result = handler.GetResult();
21
22 float maxValue = handler.MaxValue;
23 float minValue = handler.MinValue;
24 string[] titles = handler.Titles;
25 float[] values = handler.Values;
26
27 MonthGraphicHelper graphic = new MonthGraphicHelper(660,500);
28 Bitmap bitmap = graphic.CreateImage(titles, values, maxValue, minValue, "产品月生产量图表");
29
30 this.picBox.Image = bitmap;
31 }
32
33 private void btnAutoBegin_Click(object sender, EventArgs e)
34 {
35 _timer = new System.Timers.Timer(800);
36 _timer.Elapsed += new System.Timers.ElapsedEventHandler(timer_Tick);
37 _timer.AutoReset = true;
38 _timer.Enabled = true;
39 btnAutoBegin.Enabled = false;
40 btnAutoStop.Enabled = true;
41 }
42
43 public void timer_Tick(object sender, ElapsedEventArgs e)
44 {
45 DrawingImage();
46 }
47
48 private void btnAutoStop_Click(object sender, EventArgs e)
49 {
50 if (_timer != null)
51 {
52 _timer.Stop();
53 _timer.Close();
54 _timer.Dispose();
55 btnAutoBegin.Enabled = true;
56 btnAutoStop.Enabled = false;
57 }
58 }
8-15句:主要是构建一些随机数据。 public class ProductMonthInfo:MonthInfo ,ProductMonthInfo继承自MonthInfo 。
18-25句:处理传入的数据,构建完整的并且排序过的数据。其中包括结果数据的各种属性。
27-28句:绘制Bitmap,将绘制好的二维坐标返回给客户端。
33-58句:主要是为了让程序定时绘制图片(随机数据的绘制)。每隔一段时间界面将重新生成新的二维坐标图。
(六)总结
通过昨天一整天的编码,基本框架如上。这段时间以来,个人感觉对代码的整体把握能力有所提高,代码风格以及质量也一样提高不少,因此才有这种冲动写上了上面的代码。鉴于代码的风险,因此采用合适的技术(比如泛型,LINQ,DYNAMIC等)可以避免很多风险,单元测试也不会太累。代码越少,风险越少,但是质量必须保证。哈哈,哥可以因为单元测试做得不够,被鄙视了N回了(路径算法从hashtable--->自定义hashtable-->自定义单链表-->数组-->职责链设计模式-->最终被鄙视。汗,一个星期每天换一种方式,连算法需求都改了3次,每天写1000多行代码,全部挂了,重做,原因就是整体把握能力不够、把问题想得太复杂,得好好研究下UML了)。2011年,新的开始,新的未来,在挑战中升华。
源代码下载地址:自定义二维坐标月度信息图绘制源代码
继GC垃圾收集器模拟后,在这段时间境界有所突破,特别是编码风格以及代码质量有所提高,还有就是对程序的整体把握能力有了新的突破。至于突破的原因,归根于某位大虾******(哥被鄙视了N回,哈哈)。通过比较并且分析这位大虾与自己的代码的差距,本人学到了很多东西。有些东西只能意会,反而表达不出来。
以下的内容,本人昨天从早上一直写到晚上,主要是针对如何绘制月信息图(全部是随机的,包括月份数,单位大小等等,这些都是可以设置的,你仅仅需要传递一个需要转换的数据以及几个参数就可以了。连数据是间隔的也可以。)。 这个是可以脱离于Winform的,因为本人已经将其分离出来了。还有一点需要说明:本人对Winform不太熟悉,只是拿来显示下界面效果而已,界面比较粗糙。当然,由于时间有限,不可避免会有N多BUG,还请各位牛人多多指点。
(二)初步了解
先看下如下的界面图,对整个东西有一个初步的了解。
随机图一(设置高600,宽800,月份数随机,值随机):
随机图二(设置高600,宽800,月份数随机,值随机):
随机图三(设置高400,宽480,月份数随机,值随机):
通过对上面3张图片的比较与分析,你应该已经发现了如下规则:
(1)月份数目是随机的,月份标题也会根据数目的不同而随机变化。
(2)显示内容的宽度和高度是可以控制的。
(3)Y轴内容(值)也会根据传入的数据来自动设置相应的Y轴值。同样,X轴的标题也会根据需要显示的月份数而进行自动设置。
(4)月度数据是随机的,显示正常。
等等,还有其他的,这里就不再多说了,具体内容还得看代码。
(三)对项目所有文件布局的整体把握
MonthInfo.cs:月份信息基类。
MonthInfoHandler.cs:月份信息处理类。对传入的数据进行处理,返回相关数据的属性特征值以及经过处理后的结果集合。
MonthGraphicHelper.cs:图形绘制处理类。对传入的数据进行处理,绘制与数据相对应的二维坐标。
ProductMonthInfo.cs:为MonthInfo的子类,主要是为了充分利用MonthInfo的所有功能。你可以通过继承MonthInfo来利用以上的所有功能。
看一下我们的类图,你能够从整体上把握类的功能,如下:
(四)详细讲解以上文件的内容以及作用
(1)MonthInfo类为月份信息类。其中实现IComparable<T>接口主要是为了实现List<T>.Sort()排序,使数据能够相互比较,并且按照年份、月份来进行排序。
1 public class MonthInfo:IComparable<MonthInfo>
2 {
3 //中间其他的省略.............
#region IComparable<MonthInfo> 成员
59
60 int IComparable<MonthInfo>.CompareTo(MonthInfo other)
61 {
62 if (other == null)
63 {
64 return -1;
65 }
66
67 if (this.Year != other.Year)
68 {
69 return decimal.Compare(this.Year,other.Year);
70 }
71
72 return decimal.Compare(this.Month,other.Month);
73 }
74
75 #endregion
76 }
(2)MonthInfoHandler<T>类主要是处理MonthInfo的子类集合(T : MonthInfo,new ())。通过 public MonthInfoHandler(List<T> list,int count)构造函数来设置需要处理的集合数据以及数据中最大的年份月份往前推的月份数(比如传入的数据最大的年份月份为2011-10,那么从最大的年份月份往前推10个月,那么就需要计算到2011-1月的数据)。主要的算法都集中在GetResult()方法中。
先看如下的代码,然后再讲解算法。
1 public class MonthInfoHandler<T> where T : MonthInfo,new ()
2 {
12 public MonthInfoHandler(List<T> list,int count)
58 {
59 this.Current = list;
60 this.Count = count;
61 }
62
89 public byte[] Months
90 {
91 get
92 {
93 return (from e in this.Result
94 where !string.IsNullOrEmpty(e.Title)
95 select e.Month).ToArray<byte>();
96 }
97 }
98
99 /// <summary>
100 /// 获取月度信息结果集合
101 /// </summary>
102 /// <returns></returns>
103 public List<MonthInfo> GetResult()
104 {
105 if(this.Current==null||this.Current.Count==0)
106 {
107 return null;
108 }
109
110 this.Result = new List<MonthInfo>();
111 this.Current.Sort();
112 T lastInfo = this.Current.Last();
113
114 short year = lastInfo.Year;
115 byte month = lastInfo.Month;
116 for (int index = 0; index < this.Count; index++)
117 {
118 this.Result.Add(new MonthInfo(year,month));
119 month--;
120 if(month==0)
121 {
122 year--;
123 month = 12;
124 }
125 }
126
127 foreach(var item in this.Current)
128 {
129 int index=this.Result.FindIndex(p => p.Year == item.Year && p.Month ==item.Month);
130 if (index >= 0)
131 {
132 this.Result[index].Value = item.Value;
133 }
134 }
135
136 this.Result.Sort();
137 return this.Result;
138 }
139 }
算法111-115行先对传入的数据进行排序,使数据为递增的形式呈现。然后获取最后的一个对象,因而获取最大的年份、月份数值。你肯定想问:为什么这么做?这是因为传入的数据有时候是杂乱的、没有顺序的。这里仅仅是为了获取最大的年份、月份值而已。
116-125:设置Result数据。通过最大的年份与月份往前推N个月,因此Result数据也应该有N个对象。当月份等于0时候,年份减1,月份设置为12。这个是常识,哈哈。
127-134:遍历传入的数据集合,通过List<T>.FindIndex();来获取与item年份、月份相等的第一个对象(Result集合中的某个对象)的索引(单链表起始索引为0)。如果存在,将item的值赋给Result中对应的对象。
136:将Result中的数据进行排序(反转也可以)。到这一步,我们的数据已经处理好了,年份、月份的数据都是连续的,并且是排序过的。
其中,处理结果的各种相关数据,比如Values ,Titiles , Months等等都是可以获取的。
(3)MonthGraphicHelper.cs类,图像绘制类,主要负责对传入数据的分析和绘制。
构造函数设置图的宽度和高度,以及X,Y的标识,中心点(二维坐标的原点)
1 public MonthGraphicHelper(int width,int height,string xMark,string yMark)
2 {
3 this.YMark = xMark??"单位";
4 this.XMark = yMark??"月份";
5 this.BitmapWidth = width > 0 ? width : 800;
6 this.BitmapHeight = height > 0 ? height : 600;
7 this.CenterPointF = new PointF(this.YSpan, this.BitmapHeight - this.YSpan * 2);
8 }
主要绘制过程如下:
10 public Bitmap CreateImage(string[] titles, float[] values, float maxValue, float minValue, string title)
11 {
12 int count = titles.Length;
13 this.Titles = titles;
14 this.Values = values;
15
16 Bitmap bitmap = new Bitmap(this.BitmapWidth, this.BitmapHeight);
17 Graphics graphics = Graphics.FromImage(bitmap);
18 graphics.Clear(Color.White);
19
20 //绘制图表标题
21 title += " <"+DateTime.Now.ToString("yyyy-MM-dd HH:mm:ss")+">";
22 graphics.DrawString(title,
23 new Font("宋体", 14),
24 Brushes.Green,
25 new PointF(this.CenterPointF.X + 60,20));
26
27 //计算X,Y单位长度
28 CalculateXYUnitLength(maxValue, minValue, count);
29
30 //绘制Y轴内容
31 DrawYContent(count, graphics);
32
33 //绘制X轴内容
34 DrawXContent(count, graphics);
35
36 return bitmap;
37 }
其中这里又可以分为如下几个步骤:
(3A)绘制图标标题,略。
(3B)计算X,Y单位长度。通过传入的月份数据最大值和最小值,以及设置的YCount数目,计算出Y单位高度以及Y单位值。通过传入的月份个数,计算出X的单位长度。
1 private void CalculateXYUnitLength(float maxValue, float minValue, int count)
2 {
3 float yMaxValue = maxValue - minValue;
4 float yLength = this.CenterPointF.Y - this.YSpan * 3;
5
6 if (YCount > 1)
7 {
8 YUnitHeight = (float)Math.Round((double)yLength / (YCount - 1), 0);
9 YUnitValue = (float)Math.Round((double)yMaxValue / (YCount - 1), 0);
10 }
11
12 if (count > 1)
13 {
14 float xLength = this.BitmapWidth - this.CenterPointF.X - this.XSpan * 2;
15 XUnitWidth = (float)Math.Round((double)xLength / (count - 1), 0);
16 }
17 }
(3C)绘制Y轴内容,以下都是做了注释的,不再做重复说明。
6 private void DrawYContent(int count, Graphics graphics)
7 {
8 //绘制Y箭头
9 DrawYPolygon(graphics);
10
11 //画y轴线
12 graphics.DrawLine(Pens.Black,
13 this.CenterPointF.X,
14 this.CenterPointF.Y,
15 this.CenterPointF.X,
16 this.YSpan);
17
18 graphics.DrawString(this.YMark, new Font("宋体", 12),
19 Brushes.Black, new PointF(0, this.YSpan - 25));
20
21 //绘制Y轴数据
22 for (int index = 0; index <= YCount; index++)
23 {
24 graphics.DrawString((index * YUnitValue).ToString(),
25 new Font("宋体", 11),
26 Brushes.Black,
27 new PointF(this.CenterPointF.X - 30,
28 this.CenterPointF.Y - index * YUnitHeight - 6));
29 graphics.DrawLine(Pens.Black,
30 this.CenterPointF.X - 3,
31 this.CenterPointF.Y - index * YUnitHeight,
32 this.CenterPointF.X,
33 this.CenterPointF.Y - index * YUnitHeight);
34 }
35 }
绘制后的效果如下所示:
(3D)绘制X轴内容
1 private void DrawXContent(int count, Graphics graphics)
2 {
3 //绘制X箭头
4 DrawXPolygon(graphics);
5
6 DrawBasicXContent(graphics);
7
8 DrawXMonthContent(count, graphics);
9 }
看下箭头是如何绘制的,代码如下:
1 private void DrawXPolygon(Graphics graphics)
2 {
3 PointF[] polygonXPoints ={
4 new PointF(this.BitmapWidth-this.XSpan + 15, this.CenterPointF.Y),
5 new PointF(this.BitmapWidth-this.XSpan, this.CenterPointF.Y - 3),
6 new PointF(this.BitmapWidth-this.XSpan, this.CenterPointF.Y + 3) };
7
8 graphics.DrawPolygon(Pens.Red, polygonXPoints);
9 graphics.FillPolygon(new SolidBrush(Color.Red), polygonXPoints);
10 }
这里主要是通过绘制多边形来绘制箭头。发散思维考虑下:如何在二维坐标中绘制任意方向的箭头?这个需要对坐标点进行设置,可以通过对X轴、Y轴以及4个方向进行三角函数的算法设置,这个将在以后的文章中再进行考虑,本文不再考虑该箭头算法。
绘制X轴月份内容代码如下:
1 private void DrawXMonthContent(int count, Graphics graphics)
2 {
3 for (int index = 0; index < count; index++)
4 {
5 //画x轴月份标题
6 DrawMonthTitle(graphics, index);
7
8 //画点
9 DrawPoint(graphics, index);
10
11 //画数值
12 graphics.DrawString(Values[index].ToString(),
13 new Font("宋体", 11),
14 Brushes.DarkBlue,
15 new PointF(this.CenterPointF.X + (index) * this.XUnitWidth,
16 this.CenterPointF.Y - Values[index] / this.YUnitValue * this.YUnitHeight));
17
18 //画折线
19 if (index < count - 1)
20 {
21 graphics.DrawLine(Pens.Red,
22 this.CenterPointF.X + (index) * this.XUnitWidth,
23 this.CenterPointF.Y - Values[index] / this.YUnitValue * this.YUnitHeight,
24 this.CenterPointF.X + (index+1) * this.XUnitWidth,
25 this.CenterPointF.Y - Values[index + 1] / this.YUnitValue * this.YUnitHeight);
26 }
27 }
28 }
我们把Y轴的绘制注释掉,看下X轴绘制了什么,图形如下:
(五)客户端如何使用
总体的已经介绍完了,那客户端如何使用以上的内容?这就是这个步骤将要讲解的,这也是大家最关注的。先看如下代码:
1 private void btnCreate_Click(object sender, EventArgs e)
2 {
3 DrawingImage();
4 }
5
6 private void DrawingImage()
7 {
8 List<ProductMonthInfo> infos = new List<ProductMonthInfo>();
9 Random random = new Random();
10 infos.Add(new ProductMonthInfo(2010, 9, random.Next(10, 1000)));
11 infos.Add(new ProductMonthInfo(2011, 8, random.Next(10, 1000)));
12 infos.Add(new ProductMonthInfo(2011, 3, random.Next(10, 1000)));
13 infos.Add(new ProductMonthInfo(2011, 5, random.Next(10, 1000)));
14 infos.Add(new ProductMonthInfo(2011, 7, random.Next(10, 1000)));
15 infos.Add(new ProductMonthInfo(2011, 9, random.Next(10, 1000)));
16
17
18 MonthInfoHandler<ProductMonthInfo> handler =
19 new MonthInfoHandler<ProductMonthInfo>(infos, random.Next(10, 20));
20 List<MonthInfo> result = handler.GetResult();
21
22 float maxValue = handler.MaxValue;
23 float minValue = handler.MinValue;
24 string[] titles = handler.Titles;
25 float[] values = handler.Values;
26
27 MonthGraphicHelper graphic = new MonthGraphicHelper(660,500);
28 Bitmap bitmap = graphic.CreateImage(titles, values, maxValue, minValue, "产品月生产量图表");
29
30 this.picBox.Image = bitmap;
31 }
32
33 private void btnAutoBegin_Click(object sender, EventArgs e)
34 {
35 _timer = new System.Timers.Timer(800);
36 _timer.Elapsed += new System.Timers.ElapsedEventHandler(timer_Tick);
37 _timer.AutoReset = true;
38 _timer.Enabled = true;
39 btnAutoBegin.Enabled = false;
40 btnAutoStop.Enabled = true;
41 }
42
43 public void timer_Tick(object sender, ElapsedEventArgs e)
44 {
45 DrawingImage();
46 }
47
48 private void btnAutoStop_Click(object sender, EventArgs e)
49 {
50 if (_timer != null)
51 {
52 _timer.Stop();
53 _timer.Close();
54 _timer.Dispose();
55 btnAutoBegin.Enabled = true;
56 btnAutoStop.Enabled = false;
57 }
58 }
8-15句:主要是构建一些随机数据。 public class ProductMonthInfo:MonthInfo ,ProductMonthInfo继承自MonthInfo 。
18-25句:处理传入的数据,构建完整的并且排序过的数据。其中包括结果数据的各种属性。
27-28句:绘制Bitmap,将绘制好的二维坐标返回给客户端。
33-58句:主要是为了让程序定时绘制图片(随机数据的绘制)。每隔一段时间界面将重新生成新的二维坐标图。
(六)总结
通过昨天一整天的编码,基本框架如上。这段时间以来,个人感觉对代码的整体把握能力有所提高,代码风格以及质量也一样提高不少,因此才有这种冲动写上了上面的代码。鉴于代码的风险,因此采用合适的技术(比如泛型,LINQ,DYNAMIC等)可以避免很多风险,单元测试也不会太累。代码越少,风险越少,但是质量必须保证。哈哈,哥可以因为单元测试做得不够,被鄙视了N回了(路径算法从hashtable--->自定义hashtable-->自定义单链表-->数组-->职责链设计模式-->最终被鄙视。汗,一个星期每天换一种方式,连算法需求都改了3次,每天写1000多行代码,全部挂了,重做,原因就是整体把握能力不够、把问题想得太复杂,得好好研究下UML了)。2011年,新的开始,新的未来,在挑战中升华。
源代码下载地址:自定义二维坐标月度信息图绘制源代码

相关文章推荐
- 月份信息二维坐标图绘制(全部是随机数据,包括计算的月份数,附源代码)
- 月份信息二维坐标图绘制---(绘制箭头算法)续
- 月份信息二维坐标图绘制---(绘制箭头完美算法)续II
- 有五个学生,每个学生有3门课的成绩, 从键盘输入以上数据(包括姓名,三门课成绩), 输入的格式:如:zhagnsan,30,40,60计算出总成绩, 并把学生的信息和计算出的总分数高低顺序存放在磁盘文
- 在unity向量空间内绘制几何(3):通过三角形重心坐标计算任意形状网格上的随机坐标点
- 非常全面到位的介绍与源代码地址 :Python 网页爬虫 & 文本处理 & 科学计算 & 机器学习 & 数据挖掘兵器谱
- Surfer画等值线----包括参数及文件数据,源代码
- shutdown abort的情况,恢复全部控制文件和数据文件(不包括redo)
- 基于matlab读取nii体数据并进行表面绘制,计算表面积
- java网页数据抓取源代码(抓取电话和身份证信息为例)
- 一个完整BP神经网络源代码,包括数据和说明文档
- 如何使用ArcMap提取地图数据的坐标信息
- 有五个学生,每个学生有3门课的成绩,从键盘输入以上数据(包括学生号,姓名,三门课成绩), 计算出平均成绩,况原有的数据和计算出的平均分数存放在磁盘文件"stud"中。
- 使用matplotlib绘制图像并设置标题以及坐标轴等信息
- shutdown immediate的情况,丢失全部控制文件和数据文件(不包括redo),方法2
- 2014年第一季度Oracle PSU更新(包括10.2.0.4+版本号全部PSU信息)
- WayOs PPPoE群集服务器:自动同步用户信息,包括增加,更新,同步操作!保证多台服务器数据同步
- PHP注册登录:包括数据存入数据库,生成随机验证码
- Android GridView 一行显示数据(包括图片和文本),解决的办法是计算数据占该行的宽度是多少
- 给定的数据,然后随机生成这些数据,并且保证数据全部都生成一遍,不回出现重复生成的情况